. 2016 Aug 16;7(33):53165-53177.
doi: 10.18632/oncotarget.10242.

Globally increased ultraconserved noncoding RNA expression in pancreatic adenocarcinoma

Affiliations

Globally increased ultraconserved noncoding RNA expression in pancreatic adenocarcinoma

Jinmai Jiang et al. Oncotarget. .

Abstract

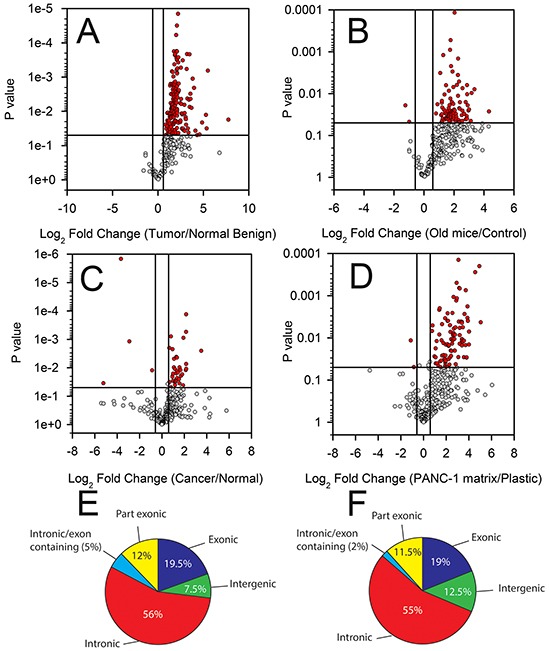
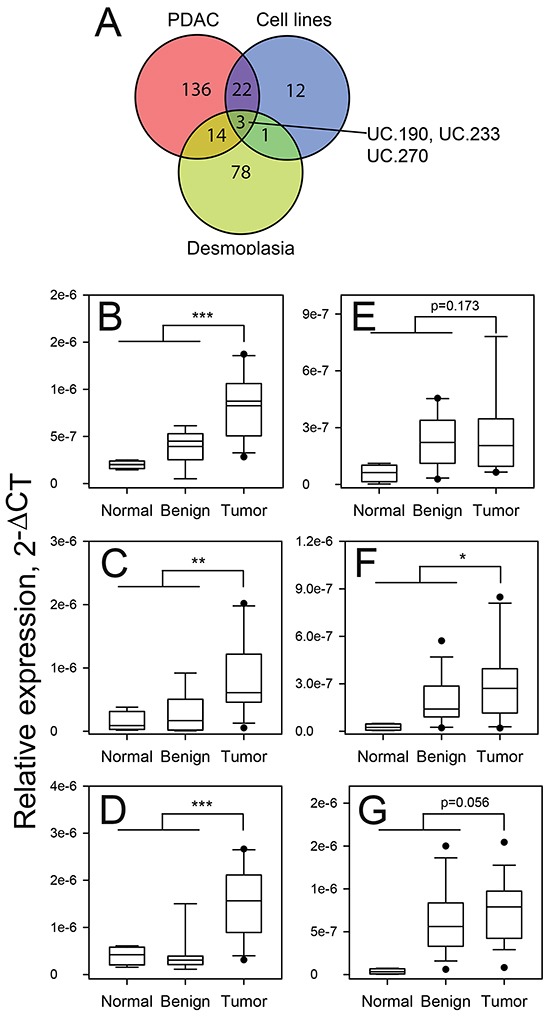
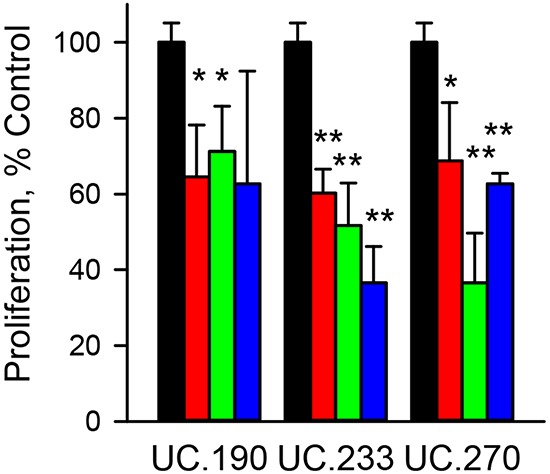
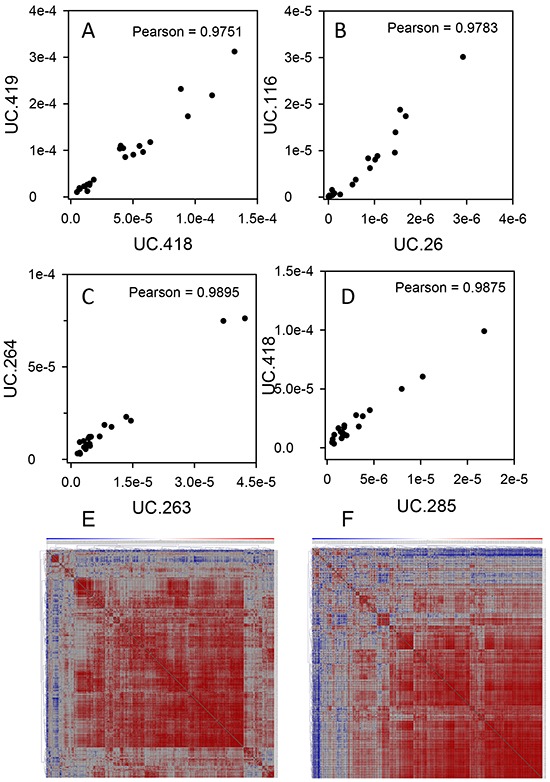
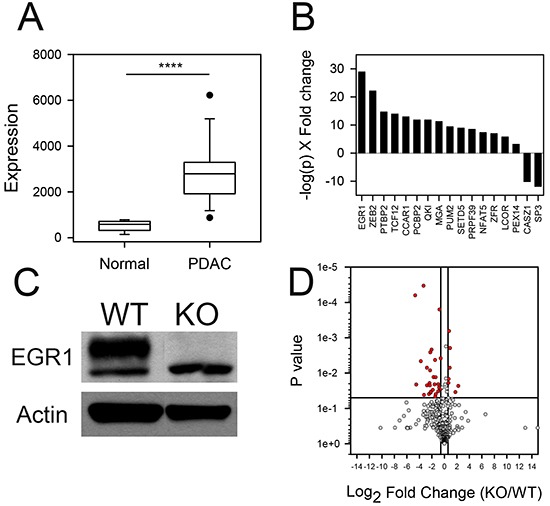
Transcribed ultraconserved regions (T-UCRs) are a class of non-coding RNAs with 100% sequence conservation among human, rat and mouse genomes. T-UCRs are differentially expressed in several cancers, however their expression in pancreatic adenocarcinoma (PDAC) has not been studied. We used a qPCR array to profile all 481 T-UCRs in pancreatic cancer specimens, pancreatic cancer cell lines, during experimental pancreatic desmoplasia and in the pancreases of P48Cre/wt; KrasLSL-G12D/wt mice. Fourteen, 57 and 29% of the detectable T-UCRs were differentially expressed in the cell lines, human tumors and transgenic mouse pancreases, respectively. The vast majority of the differentially expressed T-UCRs had increased expression in the cancer. T-UCRs were monitored using an in vitro model of the desmoplastic reaction. Twenty-five % of the expressed T-UCRs were increased in the HPDE cells cultured on PANC-1 cellular matrix. UC.190, UC.233 and UC.270 were increased in all three human data sets. siRNA knockdown of each of these three T-UCRs reduced the proliferation of MIA PaCa-2 cells up to 60%. The expression pattern among many T-UCRs in the human and mouse pancreases closely correlated with one another, suggesting that groups of T-UCRs are co-activated in PDAC. Successful knockout of the transcription factor EGR1 in PANC-1 cells caused a reduction in the expression of a subset of T-UCRs suggesting that EGR1 may control T-UCR expression in PDAC. We report a global increase in expression of T-UCRs in both human and mouse PDAC. Commonalties in their expression pattern suggest a similar mechanism of transcriptional upregulation for T-UCRs in PDAC.

Keywords: EGR1; noncoding RNA; pancreas cancer; ultraconserved elements.


Conflict of interest statement

The authors have no conflicts of interest to disclose.

Figures

Figure 1
Figure 1. Differential T-UCR expression in PDAC tissues, cell lines and during experimental desmoplasia
The T-UCR expression was determined by qPCR in A. normal, adjacent benign and PDAC tissues from patients, B. in the pancreas of control and P48cre/wt; KrasLSL-G12D/wt (median 239 day old) transgenic mice, C. in PDAC and normal pancreas cell lines and D. during experimental desmoplasia. Expression values were converted to Log2 (fold change) and the Log2 (fold change) are compared to p-values using Volcano plots. Dots represent mean independent biological replicates for a given T-UCR. A threshold of P < 0.05 and fold change greater than 1.5-fold (red symbols) was applied to determine statistical significance. The genomic location of T-UCRs with increased expression in the PDAC compared to normal pancreas in human E. and in the pancreases of the old versus control transgenic mice F.
Figure 2
Figure 2. Expression of UC.190, UC.233 and UC.270 in discovery and validation cohorts of patients
The T-UCR expression was determined by qPCR in PDAC tissue specimens, cell lines and during experimental desmoplasia. A. Overlap was determined in those T-UCRs with increased expression in each setting. Three T-UCRs (UC.190, UC.233 and UC.270) were increased in all three data sets. The expression of UC.190 B, C., UC.233 D, E. and UC.270 F, G. in normal pancreas, adjacent benign tissue and PDAC was determined by qPCR in discovery (B, D, F) and validation (C, E, G) cohorts of patient tissues. * P < 0.05; ** P < 0.01; *** P < 0.001.
Figure 3
Figure 3. Effect of T-UCR knockdown on MIA PaCa-2 cells proliferation
MIA PaCa-2 cells were exposed to 40 nM of control siRNA (black bars) or siRNA to UC.190, UC.233 or UC.270 for 96 h. Three different siRNAs - siRNA_1 (red), siRNA_2 (green) and siRNA_3 (blue) were evaluated for each T-UCR. The effect of the siRNA knockdown of T-UCRs on cell proliferation was compared to control siRNA. * P < 0.05; **P < 0.01. Representative data from duplicate experiments.
Figure 4
Figure 4. T-UCR have similar pattern of expression in both human and mouse tissues
Correlations were determined for T-UCR expression in human A, B. and mouse C, D. tissues that are directly adjacent to one another (A, C) or on different chromosomes (B, D). The Pearson correlations were determined for all T-UCR gene expression in both human and mouse tissues. Of the 481 T-UCRs profiled by qPCR in 24 specimens of PDAC, adjacent benign and normal pancreas tissues, 307 were independently expressed. The pairwise Pearson correlation coefficients for all 307 expressed T-UCRs in these specimens were determined E. Of the 481 T-UCRs profiled by qPCR in pancreas of young and old P48Cre/wt; KrasLSL-G12D/wt, Pdx-1-Cre; KrasLSL-G12D/wt and control mice, 328 were independently expressed. The pairwise Pearson correlation coefficients for all 328 expressed T-UCRs in these specimens were determined F. Data are presented as heatmaps with red having the highest correlation and blue the lowest.
Figure 5
Figure 5. T-UCR expression in EGR1 knockout PANC-1 cells
A. EGR1 expression in normal pancreas and PDAC from data set GSE71989. B. Differential expression of transcription factors in patient specimens of normal pancreas and PDAC (GSE71989 data set) ranked as -log(p)×FC. C. The CRISPR/Cas9 system was used to knockout the EGR1 gene in PANC-1 pancreatic cancer cells. The immunoblot of EGR1 and beta actin are shown in EGR1 knockout (KO) and wildtype (WT) PANC-1 cells. D. Expression values of T-UCRs in the EGR1 KO compared to WT cells were converted to Log2 (fold change) and the Log2 (fold change) are compared to p-values using a Volcano plot. Dots represent the mean of triplicate biological replicates for a given T-UCR. A threshold of P < 0.05 and fold change greater than 1.5-fold (red symbols) was applied to determine statistical significance, **** P < 0.0001.

References

    1. Siegel RL, Miller KD, Jemal A. Cancer statistics, 2015. CA Cancer J Clin. 2015;65:5–29. - PubMed
    1. Rahib L, Smith BD, Aizenberg R, Rosenzweig AB, Fleshman JM, Matrisian LM. Projecting cancer incidence and deaths to 2030: the unexpected burden of thyroid, liver, and pancreas cancers in the United States. Cancer Res. 2014;74:2913–2921. - PubMed
    1. Omura N, Goggins M. Epigenetics and epigenetic alterations in pancreatic cancer. Int J Clin Exp Pathol. 2009;2:310–326. - PMC - PubMed
    1. Jones S, Zhang X, Parsons DW, Lin JC, Leary RJ, Angenendt P, Mankoo P, Carter H, Kamiyama H, Jimeno A, Hong SM, Fu B, Lin MT, Calhoun ES, Kamiyama M, Walter K, et al. Core signaling pathways in human pancreatic cancers revealed by global genomic analyses. Science. 2008;321:1801–1806. - PMC - PubMed
    1. Liang WS, Craig DW, Carpten J, Borad MJ, Demeure MJ, Weiss GJ, Izatt T, Sinari S, Christoforides A, Aldrich J, Kurdoglu A, Barrett M, Phillips L, Benson H, Tembe W, Braggio E, et al. Genome-wide characterization of pancreatic adenocarcinoma patients using next generation sequencing. PLoS One. 2012;7:e43192. - PMC - PubMed

Substances