. 2016 Aug 23;7(34):54515-54525.
doi: 10.18632/oncotarget.10248.

Crizotinib inhibits NF2-associated schwannoma through inhibition of focal adhesion kinase 1

Affiliations

Crizotinib inhibits NF2-associated schwannoma through inhibition of focal adhesion kinase 1

Scott Troutman et al. Oncotarget. .

Abstract

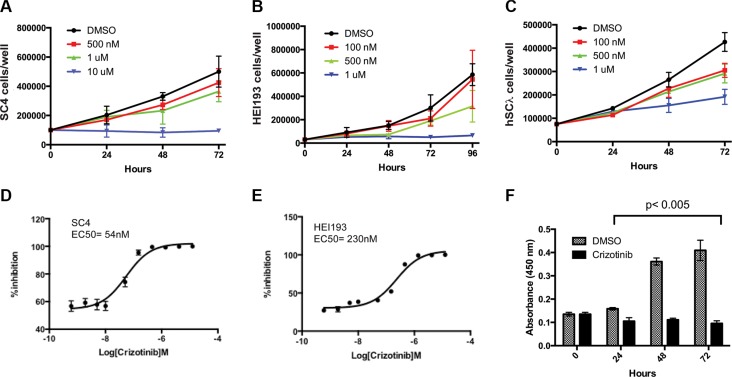
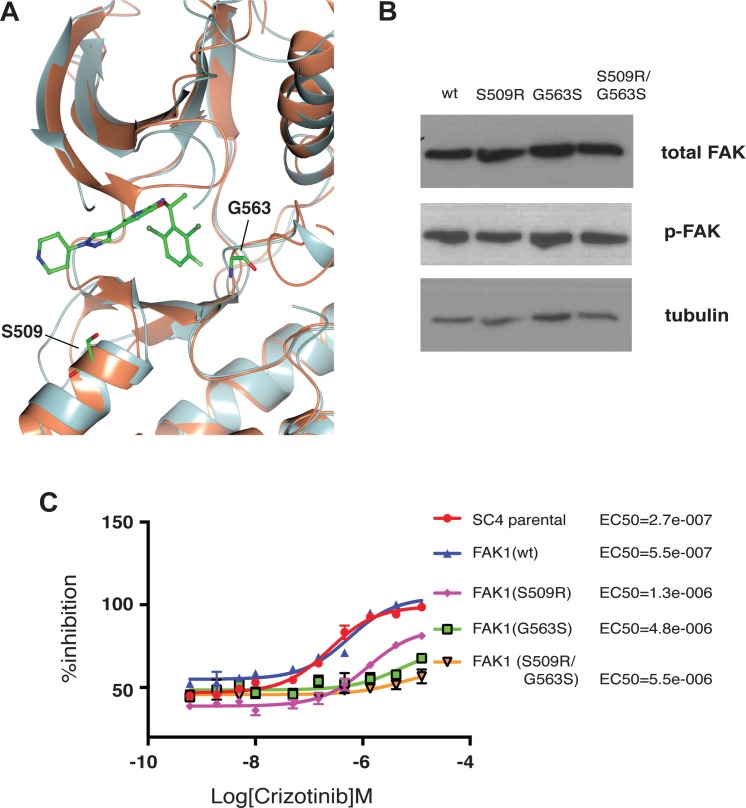
Neurofibromatosis type 2 (NF2) is a dominantly inherited autosomal disease characterized by schwannomas of the 8th cranial nerve. The NF2 tumor suppressor gene encodes for Merlin, a protein implicated as a suppressor of multiple cellular signaling pathways. To identify potential drug targets in NF2-associated malignancies we assessed the consequences of inhibiting the tyrosine kinase receptor MET. We identified crizotinib, a MET and ALK inhibitor, as a potent inhibitor of NF2-null Schwann cell proliferation in vitro and tumor growth in vivo. To identify the target/s of crizotnib we employed activity-based protein profiling (ABPP), leading to identification of FAK1 (PTK2) as the relevant target of crizotinib inhibition in NF2-null schwannoma cells. Subsequent studies confirm that inhibition of FAK1 is sufficient to suppress tumorigenesis in animal models of NF2 and that crizotinib-resistant forms of FAK1 can rescue the effects of treatment. These studies identify a FDA approved drug as a potential treatment for NF2 and delineate the mechanism of action in NF2-null Schwann cells.

Keywords: FAK; NF2; crizotinib; neurofibromatosis; signal transduction.


Conflict of interest statement

CONFLICTS OF INTEREST

The authors declare no conflicts of interests.

Figures

Figure 1
Figure 1. Impact of crizotinib treatment on NF2-null schwann cell proliferation
(A) SC4, (B) HEI193 or (C) hSC2λ-shNF2 cells treated with crizotinib at the indicated concentrations or with 25% DMSO control, daily for 3 days. (D–E) 10-point dose response curves assessing viability of SC4 or HEI193 cells treated with Crizotinib at the indicated concentrations. (F) The proliferation of SC4 cells was assessed by BrdU incorporation at 24, 48 and 72 hours post crizotinib treatment (1 μM) compared to control (DMSO). In all counting experiments cell numbers were scored daily and each time point was done in triplicate. The data shown is the mean of 3 independent experiments. Error bars = SD.
Figure 2
Figure 2. Crizotinib inhibits tumor growth in vivo
(A) Representative images from bioluminescence imaging (BLI) of mice carrying orthotopic tumors treated with crizotinib (50 mg/kg) or vehicle control (25% DMSO) at day 14 of treatment. NOD/SCID mice were injected intraneurally with 5 × 10⁴ SC4/pLuc-mCherry cells and were enrolled into treatment after 10 days. Mice were treated daily for 25 days and imaged every 3 days to follow tumor development. (B) Quantitative analysis of the flux reading from treated cohorts. A mixed-effect model analysis indicated that the speed of tumor growth in treatment group is significantly slower than that in control group (p = 0.003). (C) Distribution of tumor/body weight ratio in the cohorts treated with crizotinib or vehicle control. The results of t-test with equal variances show that the crizotinib-treated group has significant lower average tumor weight than that observed in control group (p < 0.0001). For the in vivo experiments the N = 9 in each cohort.
Figure 3
Figure 3. Expression and activity based profiling of the kinome in NF2-null schwann cells
(A) Untreated SC4 cells were extracted for RNA and analyzed by sequencing. The expressed kinases (> 1 RPKM) are indicated in yellow on the dendogram, with the size of each circle representing the log2 transformed RPKM value. (B) Untreated SC4 cells were extracted for protein and the activity-based profile of the kinome was assessed by binding to a multiplexed inhibitor bead matrix, followed by elution of bound proteins and identification/quantification by label-free mass spectrometry. The levels of each kinase identified are indicated in red on the dendogram, with the size of each circle representing the log2 transformed quantification value. (C) Time-dependent activity-based profiles for kinases that met the selection criteria. SC4 cells were treated with 10 μM crizotinib and harvested at 0, 30′, 4 h and 24 h post treatment. LFQ = Label-Free quantification values.
Figure 4
Figure 4. FAK1 is inhibited by crizotinib and required for proliferation of NF2-null schwann cells
(A) Western blot analysis of total FAK1 and p-FAKY397 in protein extracts prepared from SC4 and HEI193 cells treated with crizotinib (10 μM for 10′ and 30′). Vinculin was used as a loading control. (B) Cell number counts of SC4 cells and western blot analysis of total FAK1 expression in cells treated with 2 independent shRNAs against FAK1 (shFAK-a, shFAK-b) or scrambled control (shCTRL). (C) Cell number counts of HEI193 cells and western blot analysis of total FAK1 expression in cells treated with 2 independent shRNAs against FAK1 (siFAK-a, siFAK-b) or scrambled control (siCTRL). (D) SC4 or HEI193 cells treated with defactinib at the indicated doses or with DMSO control, daily for 3 days. In all counting experiments cell numbers were scored daily and each time point was done in triplicate. The data shown represent the mean of 3 independent experiments. Error bars = SD.
Figure 5
Figure 5. Crizotinib-resistant FAK1 mutants rescue proliferation of treated NF2-null schwann cells
(A) Superimposition of the FAK1 (orange) and ALK (gray) kinase domains with crizotinib (ball and stick). Residues Glycine 509 (G509) and Serine 563 (S563) are highlighted (ball and stick). (B) Western blot analysis of the different FAK1 mutant expression in stably transfected SC4 cells. Vinculin was used as a loading control (C) 10-point dose response curves assessing EC50 of crizotinib in SC4 cells stably expressing crizotinib resistant FAK1 mutants. Calculated EC50 for each clone is indicated to the right. The data shown represents the mean of 3 independent experiments, each done in quadruplicate. Error bars = SD.

References

    1. Gusella JF, Ramesh V, MacCollin M, Jacoby LB. Merlin: the neurofibromatosis 2 tumor suppressor. Biochim Biophys Acta. 1999;1423:M29–36. - PubMed
    1. Stamenkovic I, Yu Q. Merlin, a “magic” linker between extracellular cues and intracellular signaling pathways that regulate cell motility, proliferation, and survival. Curr Protein Pept Sci. 2010;11:471–84. - PMC - PubMed
    1. Morrison H, Sherman LS, Legg J, Banine F, Isacke C, Haipek CA, Gutmann DH, Ponta H, Herrlich P. The NF2 tumor suppressor gene product, merlin, mediates contact inhibition of growth through interactions with CD44. Genes Dev. 2001;15:968–80. - PMC - PubMed
    1. Torres-Martin M, Lassaletta L, San-Roman-Montero J, De Campos JM, Isla A, Gavilan J, Melendez B, Pinto GR, Burbano RR, Castresana JS, Rey JA. Microarray analysis of gene expression in vestibular schwannomas reveals SPP1/MET signaling pathway and androgen receptor deregulation. Int J Oncol. 2013 - PMC - PubMed
    1. Kissil JL, Wilker EW, Johnson KC, Eckman MS, Yaffe MB, Jacks T. Merlin, the product of the Nf2 tumor suppressor gene, is an inhibitor of the p21-activated kinase, Pak1. Mol Cell. 2003;12:841–9. - PubMed