. 2016 Jul 1:6:28889.
doi: 10.1038/srep28889.

ITGAV and ITGA5 diversely regulate proliferation and adipogenic differentiation of human adipose derived stem cells

Affiliations

ITGAV and ITGA5 diversely regulate proliferation and adipogenic differentiation of human adipose derived stem cells

E M Morandi et al. Sci Rep. .

Abstract

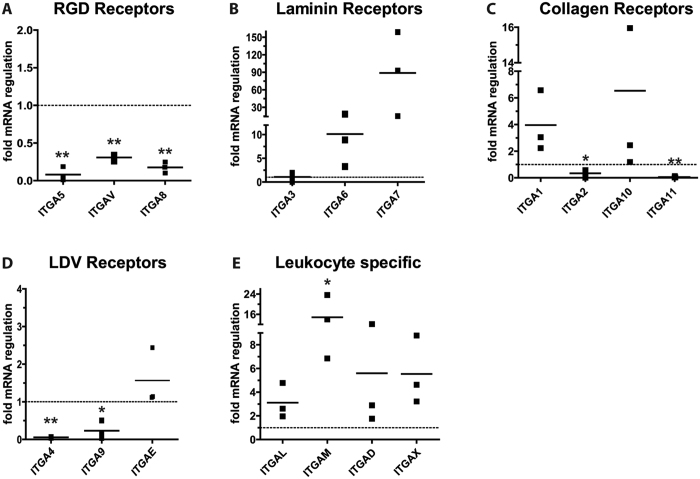
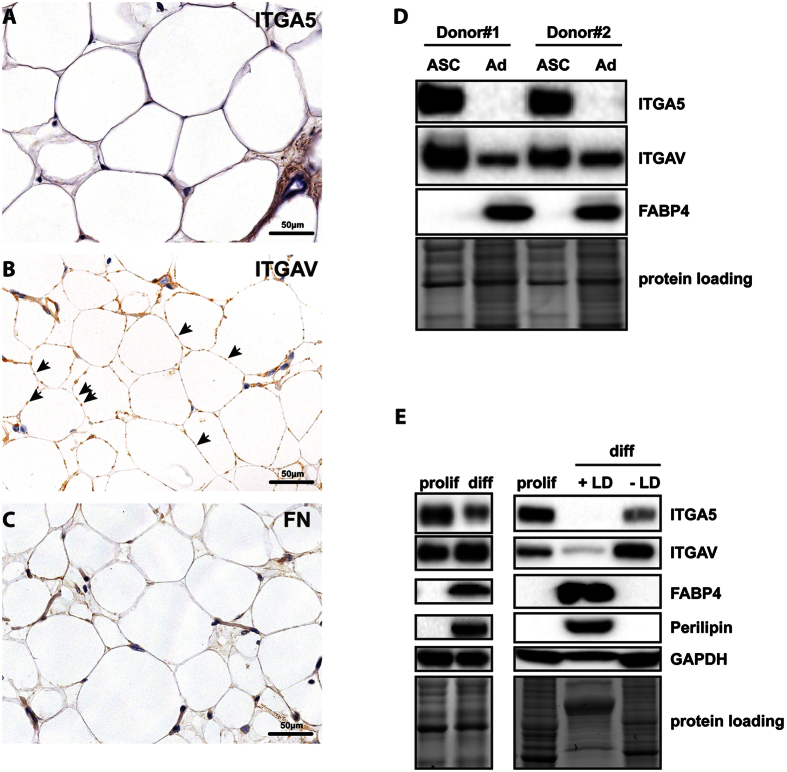
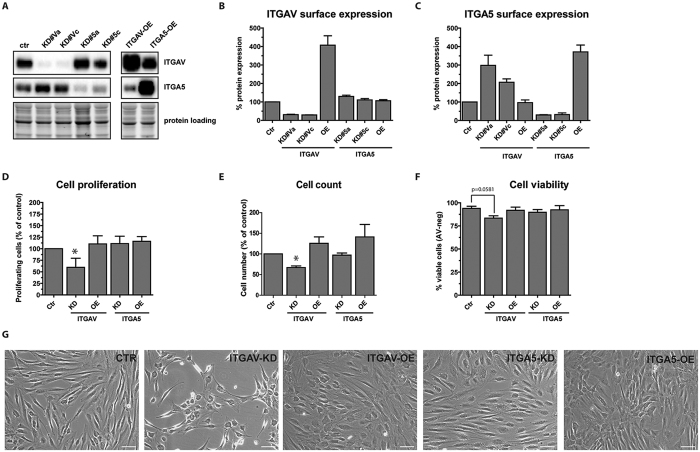
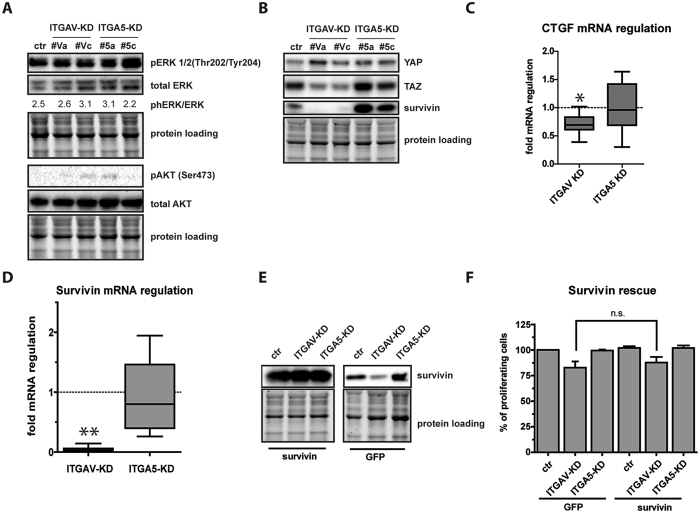
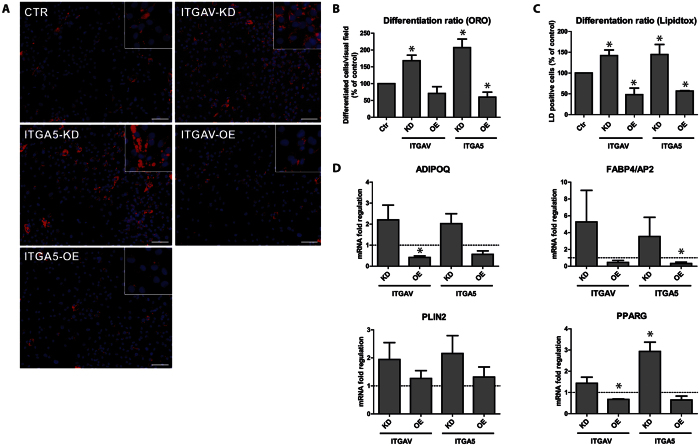
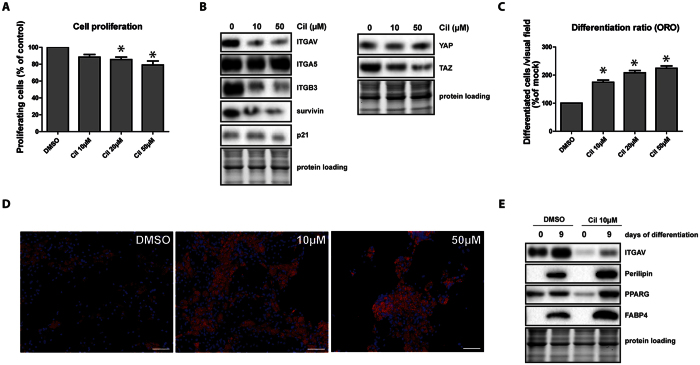
The fate of human adipose tissue stem cells (ASCs) is largely determined by biochemical and mechanical cues from the extracellular matrix (ECM), which are sensed and transmitted by integrins. It is well known that specific ECM constituents influence ASC proliferation and differentiation. Nevertheless, knowledge on how individual integrins regulate distinct processes is still limited. We performed gene profiling of 18 alpha integrins in sorted ASCs and adipocytes, identifying downregulations of RGD-motif binding integrins integrin-alpha-V (ITGAV) and integrin-alpha-5 (ITGA5), upregulation of laminin binding and leukocyte-specific integrins and individual regulations of collagen and LDV-receptors in differentiated adipocytes in-vivo. Gene function analyses in in-vitro cultured ASCs unraveled differential functions of ITGA5 and ITGAV. Knockdown of ITGAV, but not ITGA5 reduced proliferation, caused p21(Cip1) induction, repression of survivin and specific regulation of Hippo pathway mediator TAZ. Gene knockdown of both integrins promoted adipogenic differentiation, while transgenic expression impaired adipogenesis. Inhibition of ITGAV using cilengitide resulted in a similar phenotype, mimicking loss of pan-ITGAV expression using RNAi. Herein we show ASC specific integrin expression patterns and demonstrate distinct regulating roles of both integrins in human ASCs and adipocyte physiology suggesting a negative impact of RDG-motif signaling on adipogenic differentiation of ASCs via ITGA5 and ITGAV.


Conflict of interest statement

The authors declare no competing financial interests.

Figures

Figure 1
Figure 1. Integrin regulation in adipogenesis.
In-vivo integrin expression was analyzed in sorted primary human ASCs (CD34+/CD90+/CD31/CD45) and adipocytes isolated from subcutaneous fat tissue of three donors employing quantitative RT-PCR. Values are depicted as mean fold change in gene expression (2−ΔΔCT) of adipocytes compared to ASCs (adipocyte/ASC ratio). Integrins were grouped according to their main binding motif: (A) RGD-motif binding specific integrins, (B) laminin recognizing integrins, (C) collagen specific integrins, (D) LDV-motif recognizing and (E) leukocyte specific integrins. Data were normalized to the geometric mean of the reference genes GUSB and YWHAZ. Asterisks indicate p-values < 0.001 (**) or <0.05 (*).
Figure 2
Figure 2. Expression of fibronectin receptors ITGAV and ITGA5 in-vivo and in-vitro.
Immunohistochemistry analysis of paraffin fixed human subcutaneous fat tissue sections using specific antibodies against (A) ITGA5, (B) ITGAV and (C) fibronectin. Adipocytes can be morphologically identified as “signet ring cells” containing large fat vacuoles in the images. Protein expression was visualized using horseradish peroxidase (brown) and hematoxylin counterstaining (blue). Note the small ITGAV protein accumulations indicated by arrows at connecting adipocyte membranes (B). (D) Sorted ASCs and primary adipocytes of two representative donors (Donor#1 and Donor#2) were subjected to immunoblotting analyzing the expression of ITGA5, ITGAV and adipocyte specific marker FAPB4. (E) Cell lysates of in-vitro differentiated ASCs (day 14, left panel; proliferating cells are labeled with “prolif”, differentiated cells are labeled with “diff”) and the same cells separated according to their lipid droplet content (LD, right panel; lipid droplet containing cells are labeled with “+LD”, cells containing no lipid droplets are labeled with “−LD”) were subjected to immunoblotting detecting ITGAV, ITGA5, GAPDH and the adipocyte specific markers FABP4 and PLIN1. As loading controls of the depicted immunoblots cropped images of total protein stains acquired before blotting are shown. Full length gels are presented in Supplementary Fig. 4.
Figure 3
Figure 3. Effect of ITGAV and ITGA5 knockdown and overexpression on cell proliferation and viability.
(A) Efficacy of two individual shRNAs designed to target ITGAV (labelled KD#Va for ITGAV-shRNA#a and KD#Vc for ITGAV-shRNA#c) and ITGA5 (labelled KD#5a for shRNA#a and KD#5c for ITGA5-shRNA#c) was determined by immunoblotting and flow cytometry analysis of ITGAV (B) and ITGA5 (C) expression in knockdown and overexpression cells five days after infection. (D) Proliferation of transduced ASCs was assessed by Prestoblue® proliferation assay and automated cell counting (E) at day five after infection. (F) The same cells were analyzed for cell viability by flow cytometry of AnnexinV/PI-stained cells. (G) Representative phase microscopy pictures of transduced ASCs, five days after infection. Data represent the mean ± SD of five experiments targeting each integrin with two independent shRNA sequences. Presented data of KD-cells have been pooled (D–F). Asterisks indicate p-values < 0.05. As loading controls of the depicted immunoblots cropped images of total protein stains acquired before blotting are shown. Full length gels are presented in Supplementary Fig. 4.
Figure 4
Figure 4. Intracellular pathway analysis links ITGAV signaling to the Hippo pathway.
For the analysis of ITGAV- or ITGA5 controlled downstream pathways, phosphorylation of MAP-kinase ERK1/2 and serine/threonine kinase AKT (A) as well as expression of the Hippo-mediators YAP, TAZ and the TAZ-target gene Survivin (B) were analyzed in ITGAV- and ITGA5 depleted cells by immunoblotting using specific antibodies. (C) Quantitative RT-PCR analysis of the TAZ target genes CTGF and survivin (D) in ITGAV- and ITGA5 knockdown cells (fold mRNA regulation 2−ΔΔCT) compared to control infected cells. Data of KD-cells have been pooled. Asterisks indicate p-values < 0.001 (**) or <0.05 (*). (E) Survivin- or Ctrl-cDNA transduced ASCs were superinfected with ITGAV- or ITGA5-targeting shRNA and analyzed for transgene expression. Samples derived from the same experiment and were processed in parallel. Data show representative immunoblots at different exposure times (left panel 2 seconds, right panel 5 minutes). (F) Cell proliferation of transgenic survivin or GFP transduced cells superinfected with ITGA5- or ITGAV-targeting shRNA was assessed five days after infection (n.s. = not significant). Data represent the mean ± SD of 3 independent experiments. As loading controls of the depicted immunoblots cropped images of total protein stains acquired before blotting are shown.
Figure 5
Figure 5. p21Cip1 is upregulated upon loss of ITGAV.
(A) Representative immunoblotting of p21Cip1, p53 and p73 in ITGAV- and ITGA5-KD cells 5 days after infection. (B) Quantitative RT-PCR analysis of p21Cip1 mRNA in ITGAV- and ITGA5-KD cells expressed as fold change in gene expression. Data of KD-cells have been pooled. Shown data represent regulation values from four independent experiments, the asterisk indicates p < 0.01. As loading controls of the depicted immunoblots cropped images of total protein stains acquired before blotting are shown.
Figure 6
Figure 6. ITGAV and ITGA5 expression impairs adipogenesis.
(A) Representative microscopic images of knockdown and overexpressing cells subjected to in-vitro adipogenic differentiation for 14 days. Lipid droplets and nuclei were visualized by Oil Red O (ORO, red) and Hoechst 33342 (blue) staining of paraformaldehyde fixed cells. (B) The number of differentiated cells was determined by counting of differentiated cells per visual field. A minimum of 5 pictures was analyzed per group in each independent experiment. (C) Cells from the same experiment were stained with HCS-LipidTOXTM-Green and differentiation was analyzed by flow cytometry, determining extent of green fluorescence. Shown data represent the mean ± SD of 5 independent experiments. Data of KD-cells have been pooled. (D) Quantitative RT-PCR analysis of adipocyte marker genes ADIPOQ, FABP4/AP2, PLIN2 and PPARG was performed at day 14 of differentation, shown data represent the mean ± SEM of 3 independent experiments. Presented data of KD-cells have been pooled. Asterisks indicate p-values < 0.05.
Figure 7
Figure 7. Pharmacological inhibition of ITGAV/B3 and ITGAV/B5 with cilengitide mimics loss of ITGAV.
(A) Proliferation of cilengidite treated ASCs was assessed by Prestoblue® proliferation assay 48 h after treatment. (B) Immunoblot analysis of ITGAV, ITGA5, ITGB3, survivin, p21Cip1, YAP and TAZ in ASCs treated with different concentrations of cilengitide for 48 h. (C) ASCs were subjected to adipogenic differentiation for 14 days and different concentrations of cilengitide were added to the medium. Extent of differentiation was visualized by Oil Red O staining (ORO) of paraformaldehyde fixed cells and assessed by counting differentiated cells per visual field. Asterisks indicate p-values < 0.05, a minimum of 5 pictures per group were analyzed in each experiment. Shown data represent the mean ± SD of 3 independent experiments. (D) Representative microscopic images of cilengitide or DMSO treated ASCs subjected to in-vitro differentiation for 14 days showing ORO stained lipid droplets (red) and Hoechst stained nuclei (blue), scale bar: 50 μm. (E) Cell lysates of day 14 differentiated ASC exposed to 10 μM cilengitide or control treatment (DMSO) were subjected to immunoblotting for expression analysis of the adipocyte specific markers FABP4 and PLIN1. As loading controls of the depicted immunoblots cropped images of total protein stains acquired before blotting are shown.

References

    1. Baglioni S. et al. Characterization of human adult stem-cell populations isolated from visceral and subcutaneous adipose tissue. FASEB journal: official publication of the Federation of American Societies for Experimental Biology 23, 3494–3505, doi: 10.1096/fj.08-126946 (2009). - DOI - PubMed
    1. Guilak F. et al. Control of stem cell fate by physical interactions with the extracellular matrix. Cell Stem Cell 5, 17–26, doi: 10.1016/j.stem.2009.06.016 (2009). - DOI - PMC - PubMed
    1. Engler A. J., Sen S., Sweeney H. L. & Discher D. E. Matrix elasticity directs stem cell lineage specification. Cell 126, 677–689, doi: 10.1016/j.cell.2006.06.044 (2006). - DOI - PubMed
    1. Lin H. Y. et al. Fibronectin and laminin promote differentiation of human mesenchymal stem cells into insulin producing cells through activating Akt and ERK. J Biomed Sci 17, 56, doi: 10.1186/1423-0127-17-56 (2010). - DOI - PMC - PubMed
    1. Takagi J. Structural basis for ligand recognition by integrins. Curr Opin Cell Biol 19, 557–564, doi: 10.1016/j.ceb.2007.09.002 (2007). - DOI - PubMed

Publication types