. 2016 Jul 1:7:11860.
doi: 10.1038/ncomms11860.

Still and rotating myosin clusters determine cytokinetic ring constriction

Affiliations

Still and rotating myosin clusters determine cytokinetic ring constriction

Viktoria Wollrab et al. Nat Commun. .

Abstract

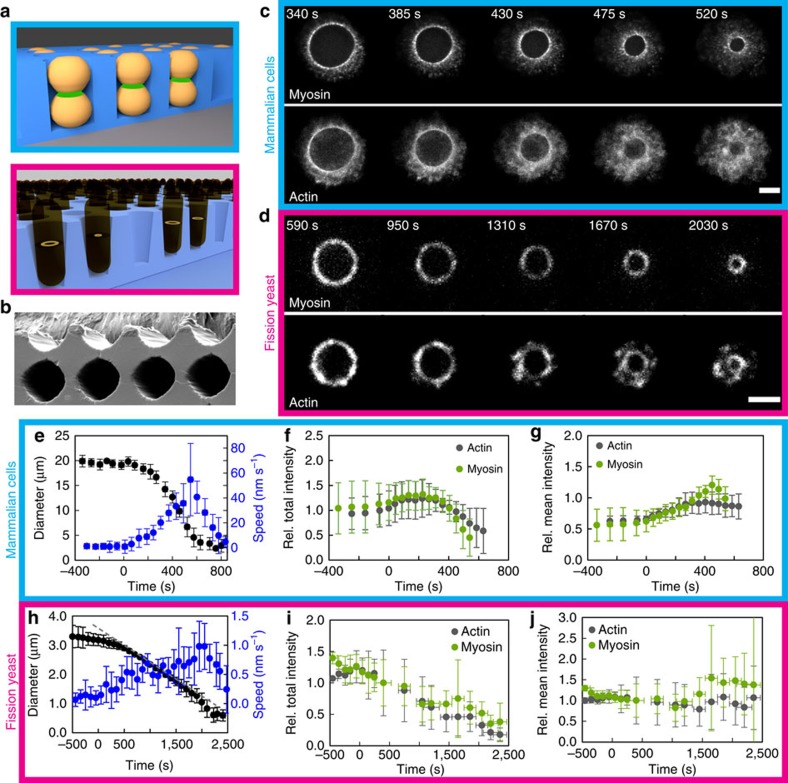
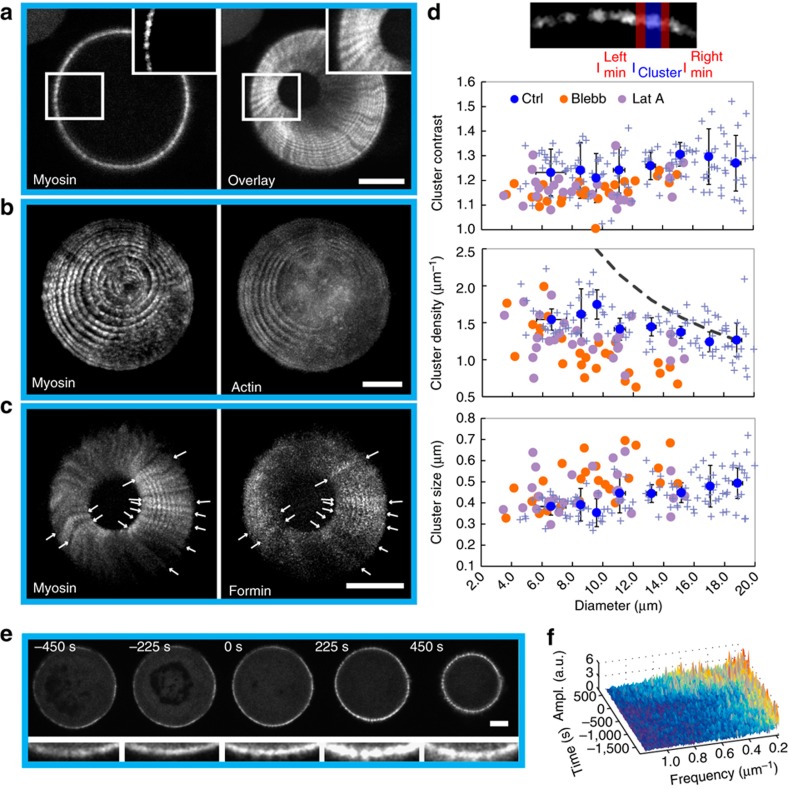
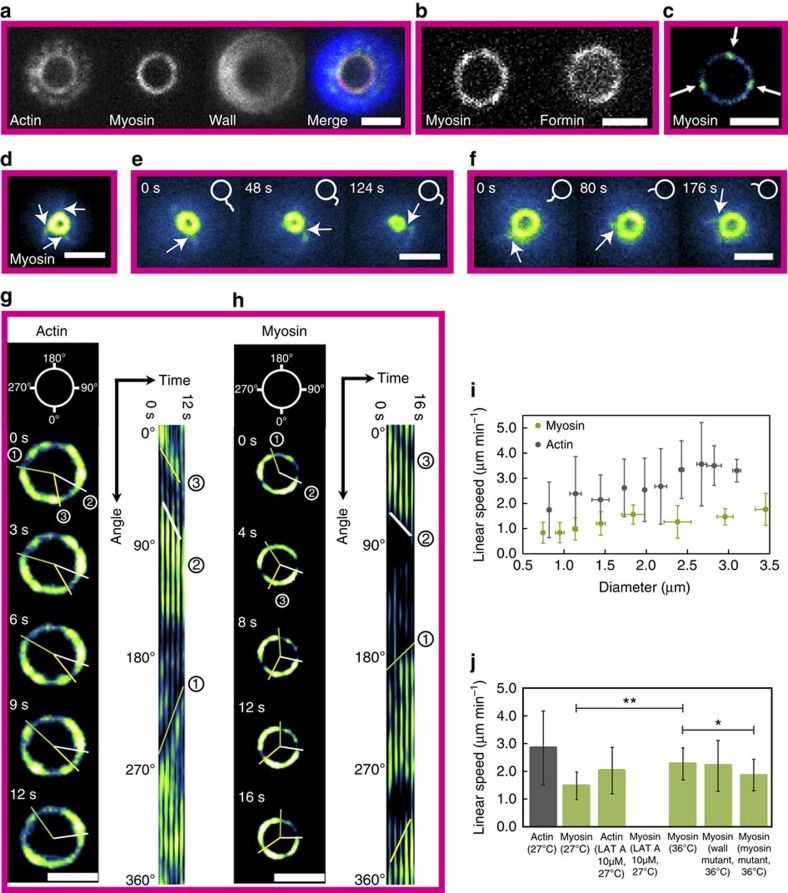
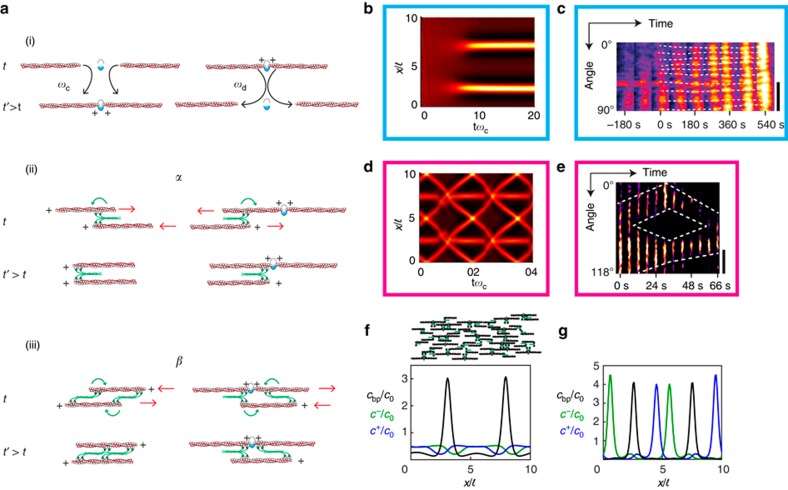
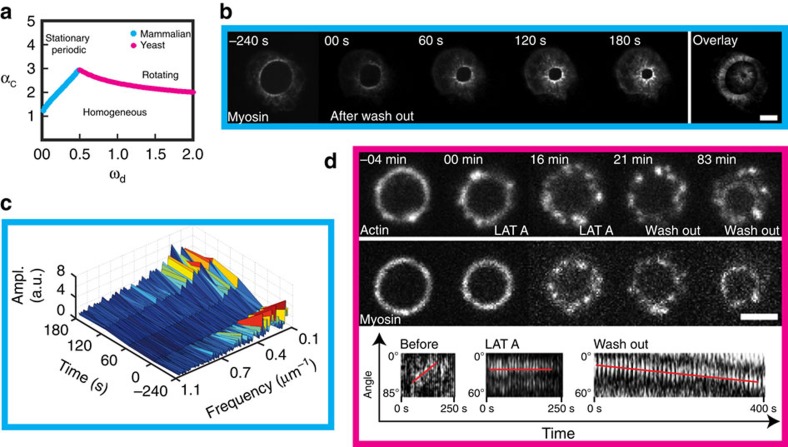
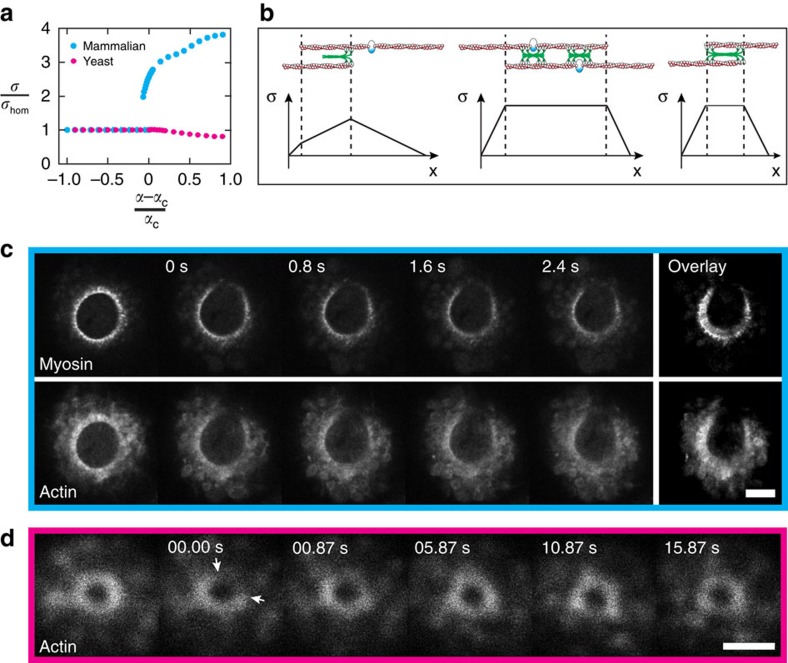
The cytokinetic ring is essential for separating daughter cells during division. It consists of actin filaments and myosin motors that are generally assumed to organize as sarcomeres similar to skeletal muscles. However, direct evidence is lacking. Here we show that the internal organization and dynamics of rings are different from sarcomeres and distinct in different cell types. Using micro-cavities to orient rings in single focal planes, we find in mammalian cells a transition from a homogeneous distribution to a periodic pattern of myosin clusters at the onset of constriction. In contrast, in fission yeast, myosin clusters rotate prior to and during constriction. Theoretical analysis indicates that both patterns result from acto-myosin self-organization and reveals differences in the respective stresses. These findings suggest distinct functional roles for rings: contraction in mammalian cells and transport in fission yeast. Thus self-organization under different conditions may be a generic feature for regulating morphogenesis in vivo.


Figures

Figure 1
Figure 1. The cytokinetic ring in one plane of focus.
(a) Cells are oriented in micro-cavities during cytokinesis along the axis of division. (b) Electron microscopy image of an array of PDMS micro-cavities. Cavity diameter=25 μm. (c,d) The cytokinetic ring visualized in mammalian cells (c, HeLa) and fission yeast (d) by myosin (MHC–GFP in c; Rlc1-mCherry in d) and actin (Lifeact-mCherry in c; CHD–GFP in d) (c) shows superimposition of five z-planes. Scale bar, 5 μm in c; 2 μm in d. Time zero is the onset of constriction. (e,h) Ring diameter and the corresponding closure speed as a function of time. (e) N=14, (h) N=20. The velocity is computed from individual constriction curves and then averaged. In h, the grey dashed line indicates the linear constriction regime. (f,g) Relative mean (g) and total (f) intensity of myosin and actin in the cytokinetic ring of mammalian cells. The intensity is normalized for cells at a diameter of 10 μm. N=10 for myosin, N=6 for actin. (i,j) Relative mean (j) and total (i) intensity of myosin and actin in the cytokinetic ring of fission yeast cells. The intensity is normalized for cells at a diameter of 3.1 μm. The intensity measurements were made from individual snapshots of rings for the time period of 300–2,500 s. N=241 for both actin and myosin. The intensities before constriction were acquired from time-lapse movies of individual rings (N=3). (ej) Error bars indicate s.d.
Figure 2
Figure 2. Cytokinetic rings of mammalian cells exhibit regular patterns.
(a) Myosin is distributed in regular clusters around the perimeter of the cytokinetic ring. Right: overlay of 25 frames, starting from the frame shown on the left. The clusters move radially, though little and collective rotations are visible for larger diameter. Time between images 10 s. (b) Overlay of 26 subsequent frames of a closing ring visualized by the fluorescence labelling of myosin and actin. Time between images 45 s, superimpositions of five z-planes, plane distance 1.3 μm. (c) The cytokinetic ring visualized by the labelling of myosin and mDia2-formin. Formin colocalizes with myosin (arrows). Overlay of 17 frames, time between frames 10 s. (d) Characterization of the myosin pattern in the control (blue) and after incubation with the cytoskeleton drugs blebbistatin (orange) and latrunculin A (purple). The cluster contrast stays about constant. The cluster density is increasing while the ring is constricting, but not as much as expected for a constant number of clusters (dashed line). Cluster density of cells treated with the two drugs is reduced. The cluster size decreases as the ring closes. Blue points represent averages, crosses correspond to single data points, error bars indicate the s.d., time-lapses of 11 closing rings were analysed. Each orange (blebbistatin) or purple (latrunculin A) point is obtained from averaging the cluster parameters from a fixed ring (blebbistatin: N=25, latrunculin A: N=28). (e) Time-lapse of a cell before, during and after formation of the cytokinetic ring visualized for myosin, below a zoomed region. Scale bar, 5 μm. (f) Fourier spectrum of the intensity profiles from the ring shown in e. At t=0 s, higher frequency structures appear. Scale bar, 5 μm in ac,e; t=0 s is the onset of constriction.
Figure 3
Figure 3. Actin and myosin cluster rotate in fission yeast rings.
(a) The fission yeast cytokinetic ring visualized by actin (CHD–GFP) myosin (Rlc1-tdTomato) and cell wall (calcofluor) labelling. (b) The ring is visualized by myosin and formin (Cdc12–GFP) labelling. Scale bar, 2 μm. (df) Representation of arms extending out of a ring (d). Arms attached to the ring (arrows) rotate counter-clockwise (e) and clockwise (f). The rings are visualized by myosin labelling (Rlc1-mCherry). Scale bar, 2 μm. (c,g,h) Representation of clusters (arrows) in the cytokinetic ring visualized by myosin (Rlc1-mCherry) (c). During ring constriction, clusters of actin (CHD–GFP) (g) and myosin (Rlc1-tdTomato) (h) rotate clockwise and counter-clockwise. The analysis is based on a kymograph representation of the ring after polar transformation. Lines highlight the motion of clusters on the ring and in the kymographs. Scale bar, 2 μm. (i) The analysis of cluster motion reveals a decrease in actin cluster speed during constriction. Myosin clusters rotate with a constant speed with decreasing speed towards the constriction completion. Error bars indicate s.d. Each point contains 4–50 measurements, 202 in total for actin and 77 for myosin. (j) Comparison of the cluster speed in different conditions and for different proteins. Rings with diameters of >1.5 μm were used. Each mean value contains 13–185 measurements. Error bars indicate s.d. One-way analysis of variance was performed, *P<0.05, **P<0.01.
Figure 4
Figure 4. Model for acto-myosin rings.
(a) Schematic of the model components and their interactions describing the parameters (see text). At each plus-end there is a motor, but only motors interacting with another filament are shown. (b,c) Kymographs of emerging stationary myosin clusters in the model (b) and in mammalian cells (c). Myosin density is colour-coded. In b, the parameter α is increased from a sub- to a supercritical value, the initial distribution was homogenous with a random perturbation. (d,e) Kymographs of rotating myosin clusters in the model (d) and in fission yeast (e). Myosin density is colour-coded, and the parameter α is constant in d. In c,e, dashed white lines serve as a guide to the eye. (f,g) Distributions of bipolar filaments (cbp, black) and polar filaments (c+, blue, c, green) corresponding to t=20 ωc−1 of Fig. 4b (f) and to t=0 of Fig. 4d (g). (f, top) In alignment, illustration of the F-actin distributions corresponding to two adjacent myosin clusters.
Figure 5
Figure 5. Myosin clusters form through a dynamic instability.
(a) Critical value of the parameter α from a linear stability analysis. Blue: stationary instability; pink: oscillatory instability. (b) Mammalian cells before and after 10 min incubation with 100 μM blebbistatin. After drug treatment, the myosin pattern is not present but reappears after wash out. Superimposition of five z-planes; scale bar, 5 μm. (c) Fourier spectrum of the intensity profiles shown in b. Characteristic frequencies are seen before blebbistatin addition and starts to reappear after blebbistatin wash out at 0 s. (d) Fission yeast cell before and after 20 min incubation with 10 μM latrunculin A. The ring disassembles, but motion of actin clusters (CHD–GFP) is still visible (see Supplementary Movie 9) while myosin (Rlc1-tdTomato) clusters are still. After wash out, the ring re-forms and constricts again. Scale bar, 2 μm. Polar-transformed kymographs of the ring in myosin (Rlc1-tdTomato) confirm different behaviours of the clusters before and during the incubation of latrunculin A and after wash out.
Figure 6
Figure 6. Motor-induced mechanical stresses in contractile rings.
(a) Calculated stress σ as a function of myosin activity α undergoing a stationary (blue) or oscillatory (pink) instability. σhom is the stress in homogeneous state. (b) Illustration of the stress profiles for pairs of a polar and a bipolar filament (left), two bipolar filaments (middle) and two polar filaments of opposite orientation (right). Stress is drawn to scale. Only motors crosslinking two filaments are shown. (c,d) Laser ablation of cytokinetic rings in mammalian cells (c) and in fission yeast (d). (c) Ring opens on cutting. Overlay (9 frames, 0.8 s) reveals constriction and radial movement of myosin clusters. Scale bar, 5 μm. (d) The ring breaks after cutting (arrows) but is repaired within seconds. Image smoothed with ImageJ. Scale bar, 2 μm.

Similar articles

Cited by

References

    1. Rappaport R. Cytokinesis in Animal Cells Cambridge Univ. Press (1996).
    1. Schroeder T. E. Molecules and Cell Movement 305–334Raven Press (1975).
    1. Eggert U. S., Mitchison T. J. & Field C. M. Animal cytokinesis: from parts list to mechanisms. Annu. Rev. Biochem. 75, 543–566 (2006). - PubMed
    1. Carvalho A., Desai A. & Oegema K. Structural memory in the contractile ring makes the duration of cytokinesis independent of cell size. Cell 137, 926–937 (2009). - PubMed
    1. Schroeder T. E. The contractile ring. II. Determining its brief existence, volumetric changes, and vital role in cleaving Arbacia eggs. J. Cell Biol. 53, 419–434 (1972). - PMC - PubMed

Publication types