. 2016 Jun 30;8(3):1759091416656253.
doi: 10.1177/1759091416656253. Print 2016 Jun.

A Complex Interaction Between Reduced Reelin Expression and Prenatal Organophosphate Exposure Alters Neuronal Cell Morphology

Affiliations

A Complex Interaction Between Reduced Reelin Expression and Prenatal Organophosphate Exposure Alters Neuronal Cell Morphology

Brian R Mullen et al. ASN Neuro. .

Abstract

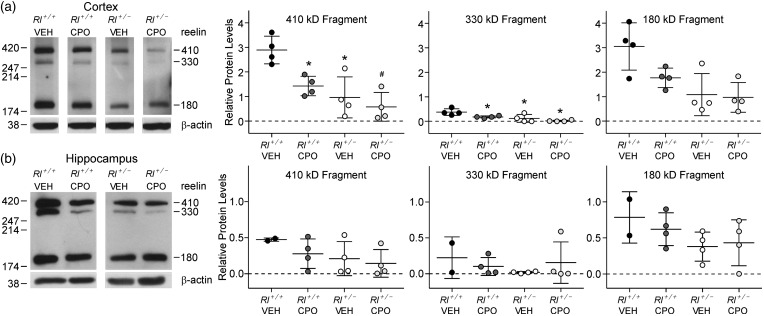
Genetic and environmental factors are both likely to contribute to neurodevelopmental disorders including schizophrenia, autism spectrum disorders, and major depressive disorders. Prior studies from our laboratory and others have demonstrated that the combinatorial effect of two factors-reduced expression of reelin protein and prenatal exposure to the organophosphate pesticide chlorpyrifos oxon-gives rise to acute biochemical effects and to morphological and behavioral phenotypes in adolescent and young adult mice. In the current study, we examine the consequences of these factors on reelin protein expression and neuronal cell morphology in adult mice. While the cell populations that express reelin in the adult brain appear unchanged in location and distribution, the levels of full length and cleaved reelin protein show persistent reductions following prenatal exposure to chlorpyrifos oxon. Cell positioning and organization in the hippocampus and cerebellum are largely normal in animals with either reduced reelin expression or prenatal exposure to chlorpyrifos oxon, but cellular complexity and dendritic spine organization is altered, with a skewed distribution of immature dendritic spines in adult animals. Paradoxically, combinatorial exposure to both factors appears to generate a rescue of the dendritic spine phenotypes, similar to the mitigation of behavioral and morphological changes observed in our prior study. Together, our observations support an interaction between reelin expression and chlorpyrifos oxon exposure that is not simply additive, suggesting a complex interplay between genetic and environmental factors in regulating brain morphology.

Keywords: cerebellum; cortex; dendrite; hippocampus; mouse model; pesticide.


Figures

Figure 1.
Figure 1.
Reelin expression in the adult cerebral cortex and hippocampus. Western blots and reelin fragment quantification from cortical (a) and hippocampal (b) tissue. Three bands representing full-length reelin (410 kDa) and two breakdown products (330 kDa and 180 kDa) were observed; each band was independently quantified compared with ß-actin. Bars in the dot plots are representative of mean ± SD. Significance determined based on comparison to vehicle-treated Rl+/+ animals (*p < .05, #p < .01) as calculated by Holm-Sidak post hoc analysis.
Figure 2.
Figure 2.
Pyramidal cell distribution in CA1 and CA3 in the hippocampus of vehicle-treated Rl+/+ mice (a), CPO-treated Rl+/+ mice (b), vehicle-treated Rl+/ mice (c), and CPO-treated Rl+/ mice (d) as revealed with DAPI labeling. The black and white pictures are inverse representations of DAPI fluorescence (white = black; black = blue). Boxed regions in CA1 and CA3 were scanned for fluorescence intensity and are represented as histograms adjacent to the high-magnification figures. Histograms illustrate group data, where the black line represents the average and gray lines represent individual animals. (e) Quantification of the half width of the pyramidal cell layer intensity peak for each group. Bars are representative of mean ± SD. Significance determined based on comparison to Rl+/+ Veh (*p < .05) as calculated by Holm-Sidak post hoc analysis.
Figure 3.
Figure 3.
Golgi-stained hippocampal pyramidal cells and representative camera lucida drawings from vehicle-treated Rl+/+ mice (a), CPO-treated Rl+/+ mice (b), vehicle-treated Rl+/ (c), and CPO-treated Rl+/ mice (d). (e) Sholl analysis of camera lucida drawings. Hippocampal pyramidal neurons from CPO-treated Rl+/+ mice have fewer intersections. * indicates significant differences in dendritic complexity as determined by two-way ANOVA. Sholl analysis is represented by mean ± SE.
Figure 4.
Figure 4.
Analysis of dendritic spines on CA1 pyramidal neurons. Apical oblique and basal dendrites of Golgi-impregnated cells (a) were analyzed for total spine density (b) and spine length (c, d). Bars in (b) indicate mean ± SE. Significance was determined based on comparison to vehicle-treated Rl+/+ cells as calculated by Holm-Sidak post hoc analysis (*p < .05).
Figure 5.
Figure 5.
Characterization of hippocampal dendritic spines. Quantification of immature (a, thin; b, branched; c, filopodial) and mature (d, stubby; e, mushroom) spine density and mushroom spine area (f) and frequency (g) on apical oblique and basal hippocampal pyramidal dendrites. Spine density is indicated as number of spines per 10 µm, while mushroom spine area is presented as µm2. Significance was determined based on comparison to vehicle-treated Rl+/+ as calculated by Holm-Sidak post hoc analysis (*p < .05; #p < .01).
Figure 6.
Figure 6.
Dendritic spine distribution and length on Purkinje cells in the anterior lobes (Lobule III and IV/V) and posterior lobes (Lobules VI and VIII) of the cerebellum. Spines were visualized on Golgi-impregnated neurons (a) and the quantified as number of spines per 10 µm (b). Spine lengths were also measured and their distribution plotted in the anterior lobules (c) and posterior lobules (d). Bars in B represent mean ± SE. Significance determined based on comparison to vehicle-treated Rl+/+ samples and was calculated by Holm-Sidak post hoc analysis (*p < .05).
Figure 7.
Figure 7.
Characterization of cerebellar dendritic spines. Quantification of immature (a, thin; b, branched; c, filopodial) and mature (d, stubby; e, mushroom) spine density and mushroom spine area (f) and frequency (g, h) in four cerebellar regions—Lobule III, Lobule IV/V, Lobule VI, and Lobule VII. Spine density is indicated as number of spines per 10 µm, while mushroom spine area is presented as µm2. Bars represent mean ± SE. Significance was determined based on comparison to vehicle-treated Rl+/+ as calculated by Holm-Sidak post hoc analysis (*p < .05; #p < .01).

References

    1. Abadesco A., Cilluffo M., Yvone G., Carpenter E., Howell B., & Phelps P. (2014) Novel Disabled-1 expressing neurons identified in adult brain and spinal cord. European Journal of Neuroscience 39: 579–592. - PubMed
    1. Abrahams B. S., Geschwind D. H. (2008) Advances in autism genetics: On the threshold of a new neurobiology. Nature Reviews Genetics 9: 341–355. - PMC - PubMed
    1. Alcantara S., Ruiz M., D’Arcangelo G. D., Ezan F., de Lecea L., Curran T., Soriano E. (1998) Regional and cellular patterns of reelin mRNA expression in the forebrain of developing and adult mouse. The Journal of Neuroscience 18: 7779–7799. - PMC - PubMed
    1. Anderson S. A., Marin O., Horn C., Jennings K., Rubenstein J. L. R. (2001) Distinct cortical migration from the medial and lateral ganglionic eminences. Development 128: 353–363. - PubMed
    1. Biamonte F., Assenzab G., Marinoa R., D’Amelioc M., Panteria R., Carusod D., Keller F. (2009) Interactions between neuroactive steroids and reelin haploinsufficiency in Purkinje cell survival. Neurobiology of Disease 36: 103–115. - PubMed

MeSH terms