Review
. 2017 May;100(5):461-475.
doi: 10.1007/s00223-016-0168-9. Epub 2016 Jul 1.

Evolution of the Marrow Adipose Tissue Microenvironment

Affiliations
Review

Evolution of the Marrow Adipose Tissue Microenvironment

Clarissa S Craft et al. Calcif Tissue Int. 2017 May.

Abstract

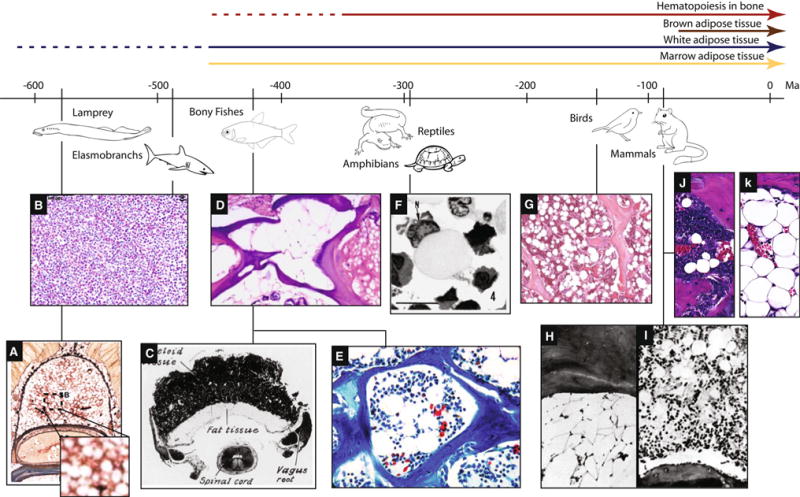
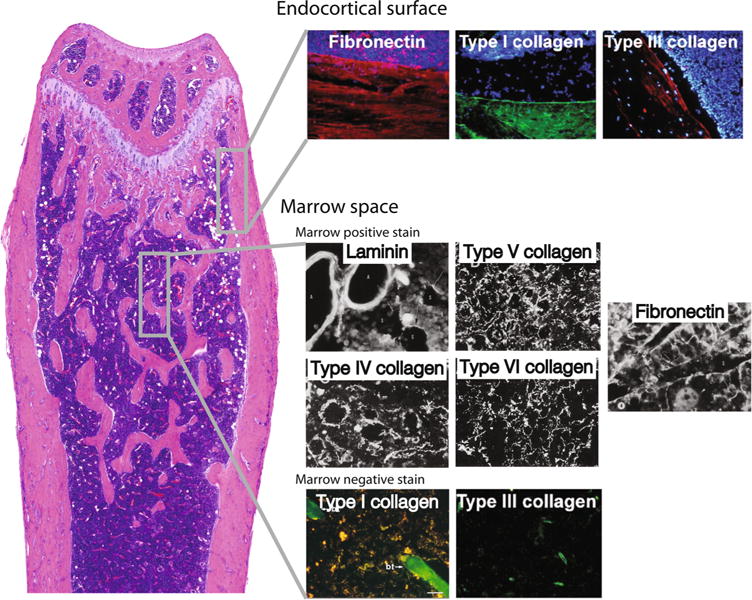
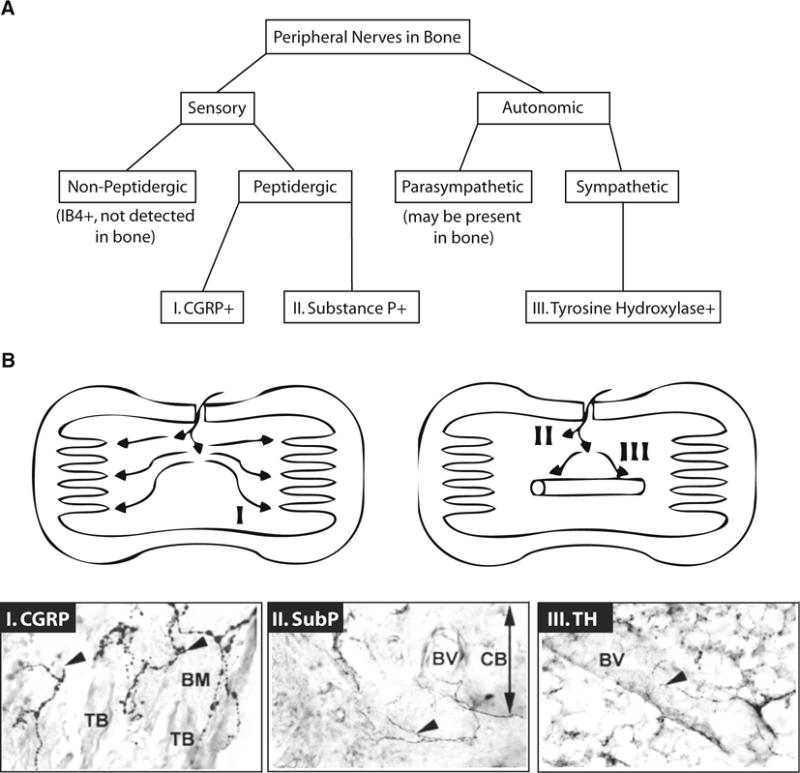
Adipocytes of the marrow adipose tissue (MAT) are distributed throughout the skeleton, are embedded in extracellular matrix, and are surrounded by cells of the hematopoietic and osteogenic lineages. MAT is a persistent component of the skeletal microenvironment and has the potential to impact local processes including bone accrual and hematopoietic function. In this review, we discuss the initial evolution of MAT in vertebrate lineages while emphasizing comparisons to the development of peripheral adipose, hematopoietic, and skeletal tissues. We then apply these evolutionary clues to define putative functions of MAT. Lastly, we explore the regulation of MAT by two major components of its microenvironment, the extracellular matrix and the nerves embedded within. The extracellular matrix and nerves contribute to both rapid and continuous modification of the MAT niche and may help to explain evolutionary conserved mechanisms underlying the coordinated regulation of blood, bone, and MAT within the skeleton.

Keywords: Adipose; Bone; Evolution; Marrow adipose tissue; Marrow fat; Matrix.


Conflict of interest statement

Conflict of Interest Clarissa S. Craft and Erica L. Scheller declare that they have no conflict of interest.

Figures

Fig. 1
Fig. 1
Evolution of MAT in vertebrates relative to bone marrow and peripheral adipose tissue. The first evidence of WAT in vertebrates occurs in the sea lamprey, prior to the evolution of an ossified skeleton. The Elasmobranchs, a group of cartilaginous fishes, have a partially ossified skeleton but no bone marrow, MAT, or WAT. MAT first becomes apparent in the bony fishes, after the evolution of endochondral bone resorption, both in the presence and absence of hematopoietic marrow. By comparison, brown adipose tissue is only present in mammals. a Groups of hematopoietic cells in the adipose tissue of the supraneural body of a postmetamorphic sea lamprey [18]. b Normal epigonal organ composed of a relatively uniform sheet of mature and developing granulocytes without adipocytes [134]. c Cross-section through the myeloid organ of Amia bony fish with adjacent fat tissue [25]. d Cross-section of zebrafish bone showing fatty filling of the skeletal space (middle) and adjacent cartilage (right) [135].e Cancellous bone of the lower jaw in the bony fish Garra congoensis with numerous marrow adipocytes (Image credit: Franck Genten) [26]. f Slimy salamander Plethodon glutinosus. Semi-thin plastic section of a fat cell in marrow. The densely stained nucleus (N) is located eccentrically in the cell, and the cytoplasm is filled with lightly stained lipid material [27]. g Bone marrow of a female Leghorn chicken showing trabeculae, hematopoietic marrow, and abundant adipocytes [36]. h Armadillo dermal plate marrow in December. Few hematopoietic cells are present but fat cells are abundant [41]. i Armadillo dermal plate marrow in October. Active hematopoietic cells interspersed with adipocytes in a typical dermal plate marrow [41]. j Red, hematopoietic bone marrow of a C3H/HeJ mouse femur containing rMAT adipocytes (Image by E.L.S.). k Yellow, fatty bone marrow of a C3H/HeJ mouse caudal vertebrae containing cMAT adipocytes (Image by E.L.S.). Adapted from [11] (Color figure online)
Fig. 2
Fig. 2
Distribution of extracellular matrix (ECM) structures within the bone. ECM composition varies across the bone; marrow adipocytes likely reside in distinct ECM microenvironments depending on their location in the marrow space. This figure is a compilation of immunofluorescence images from multiple studies, providing a basic overview of skeletal ECM organization. The endocortical surface is enriched with fibronectin and large fiber collagens (collagen-I, collagen-III). Shown is fibronectin in red, collagen-I in green, and collagen-III in red. Blue staining is nuclear staining of marrow cells. Collagen-I and collagen-III staining in the marrow space images (bottom) is limited to trabecular bone (collagen-I, green) or vessels (collagen-III, green). The remaining marrow space pictures are black-and-white immunofluorescence images. Laminin and collagen-IV (white) are basement membrane proteins associated with the marrow sinuses and arteries. Collagen-IV is also shown to localize around marrow adipocytes. The space between the vessels and bone is enriched with collagen-V and collagen-VI fibers, as well as mesh-like structures of fibronectin. Based on these images, collagen-VI may be concentrated around marrow adipocytes, similar to collagen-IV. Images reproduced with permission from the following sources: [–58, 60] (Color figure online)
Fig. 3
Fig. 3
Peripheral nerve distribution in bone. a Sensory and autonomic nerves enter the skeleton with nutrient vessels and are widely distributed around the vasculature, throughout the medullary cavity, and within the ossified matrix. Nonpeptidergic sensory nerve fibers, as evidenced by isolectin B4 (IB4) staining, have not been detected in bone [92]. However, unmyelinated peptidergic sensory fibers containing CGRP, substance P, or both neuropeptides are common [121]. There is limited evidence that the bone may be innervated by parasympathetic fibers [91]. By contrast, tyrosine hydroxylase expressing sympathetic efferent neurons are readily demonstrated [92, 121]. b Within the bone, three main patterns of neuron distribution have been identified. Pattern I, which corresponds to CGRP + sensory fibers, shows axons extending apart from the vessels, subsequently terminating in the vicinity of the osteochondral junction. Pattern II represents the substance P + sensory fibers with terminate shortly after entering through the cortical bone. Pattern III shows the tyrosine hydroxylase-positive (TH +) sympathetic axons which spiral around blood vessels with some extension into the marrow space. Corresponding immunohistochemical stains are also presented. TB: trabecular bone, BM: bone marrow, BV: blood vessel, CB: cortical bone. Diagrams and images reproduced with permission from [121]

References

    1. Adler BJ, Kaushansky K, Rubin CT. Obesity-driven disruption of haematopoiesis and the bone marrow niche. Nat Rev Endocrinol. 2014;10:737–748. doi: 10.1038/nrendo.2014.169. - DOI - PubMed
    1. Schwartz AV. Marrow fat and bone: review of clinical findings. Front Endocrinol (Lausanne) 2015;6:40. doi: 10.3389/fendo.2015.00040. - DOI - PMC - PubMed
    1. Scheller EL, Rosen CJ. What’s the matter with MAT? marrow adipose tissue, metabolism, and skeletal health. Ann N Y Acad Sci. 2014;1311:14–30. doi: 10.1111/nyas.12327. - DOI - PMC - PubMed
    1. Scheller EL, Doucette CR, Learman BS, et al. Region-specific variation in the properties of skeletal adipocytes reveals regulated and constitutive marrow adipose tissues. Nat Commun. 2015;6:7808. doi: 10.1038/ncomms8808. - DOI - PMC - PubMed
    1. Tavassoli M. Marrow adipose cells. histochemical identification of labile and stable components. Arch Pathol Lab Med. 1976;100:16–18. - PubMed

Publication types

LinkOut - more resources