. 2016 Sep 1;76(17):5040-53.
doi: 10.1158/0008-5472.CAN-15-3422. Epub 2016 Jun 30.

Activation of Wnt/β-Catenin in Ewing Sarcoma Cells Antagonizes EWS/ETS Function and Promotes Phenotypic Transition to More Metastatic Cell States

Affiliations

Activation of Wnt/β-Catenin in Ewing Sarcoma Cells Antagonizes EWS/ETS Function and Promotes Phenotypic Transition to More Metastatic Cell States

Elisabeth A Pedersen et al. Cancer Res. .

Abstract

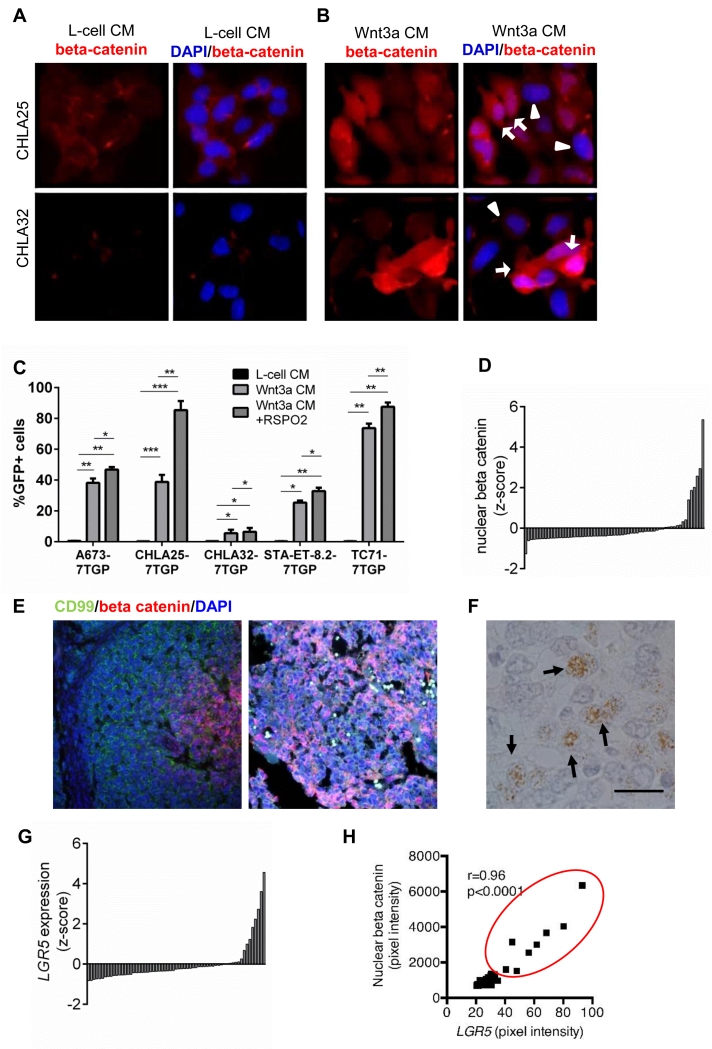
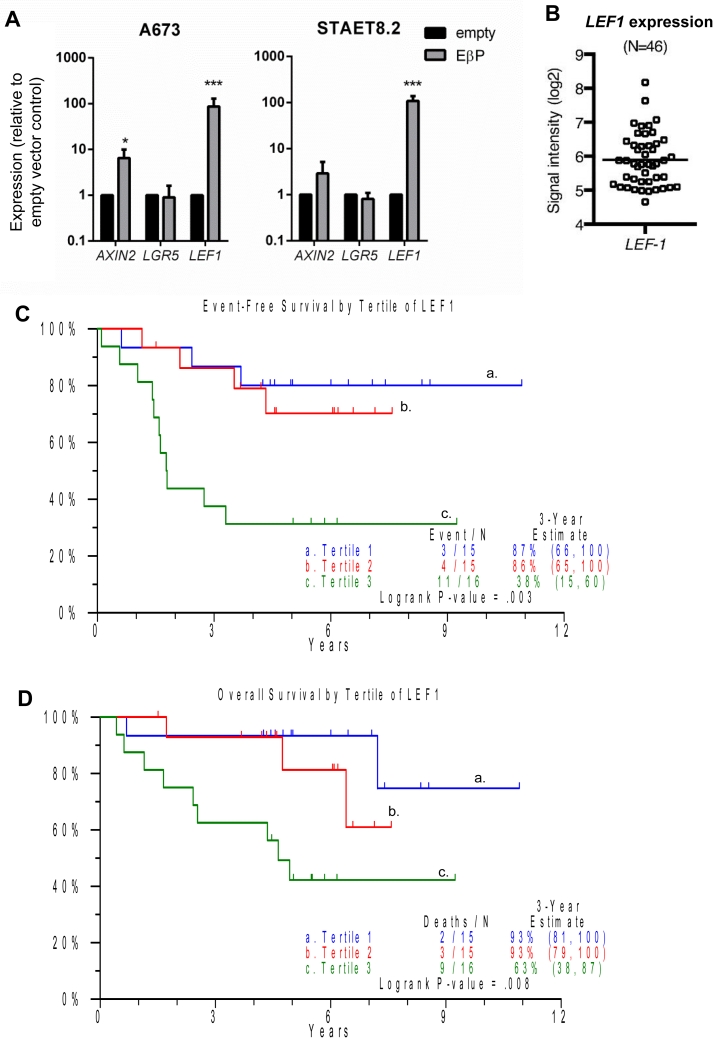
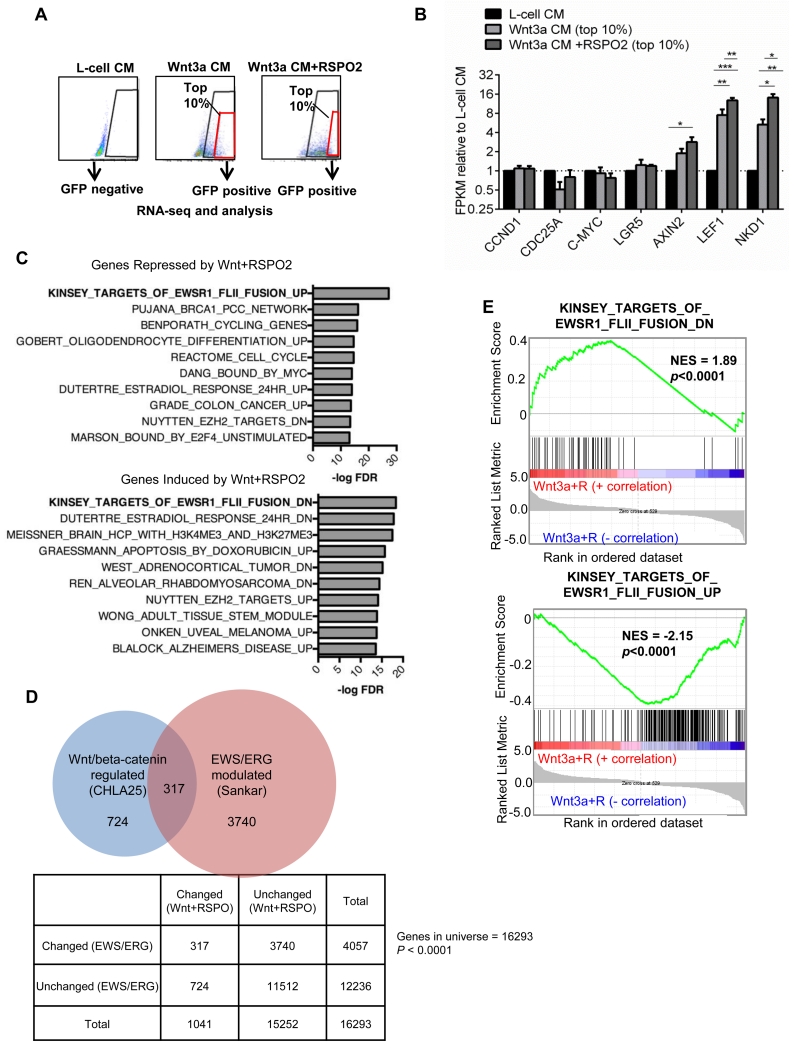
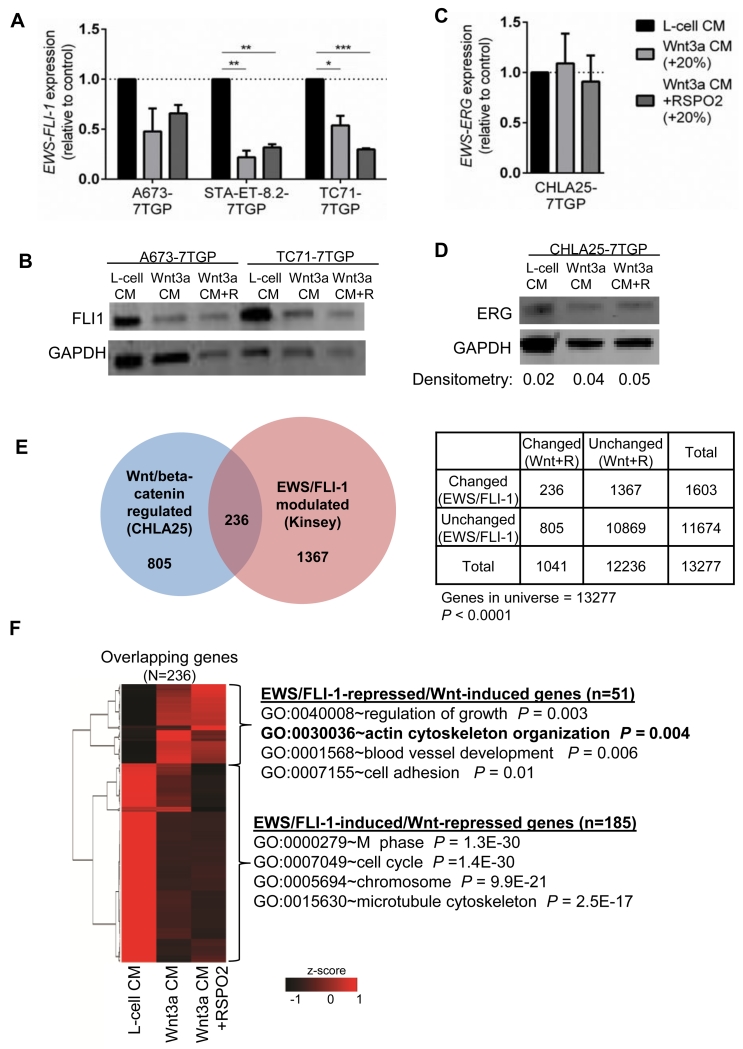
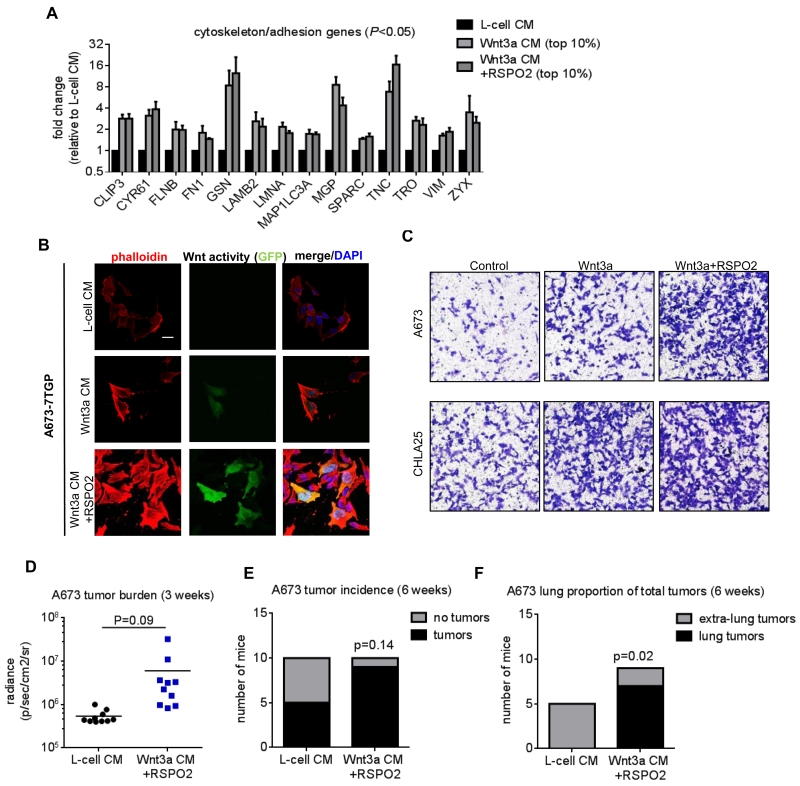
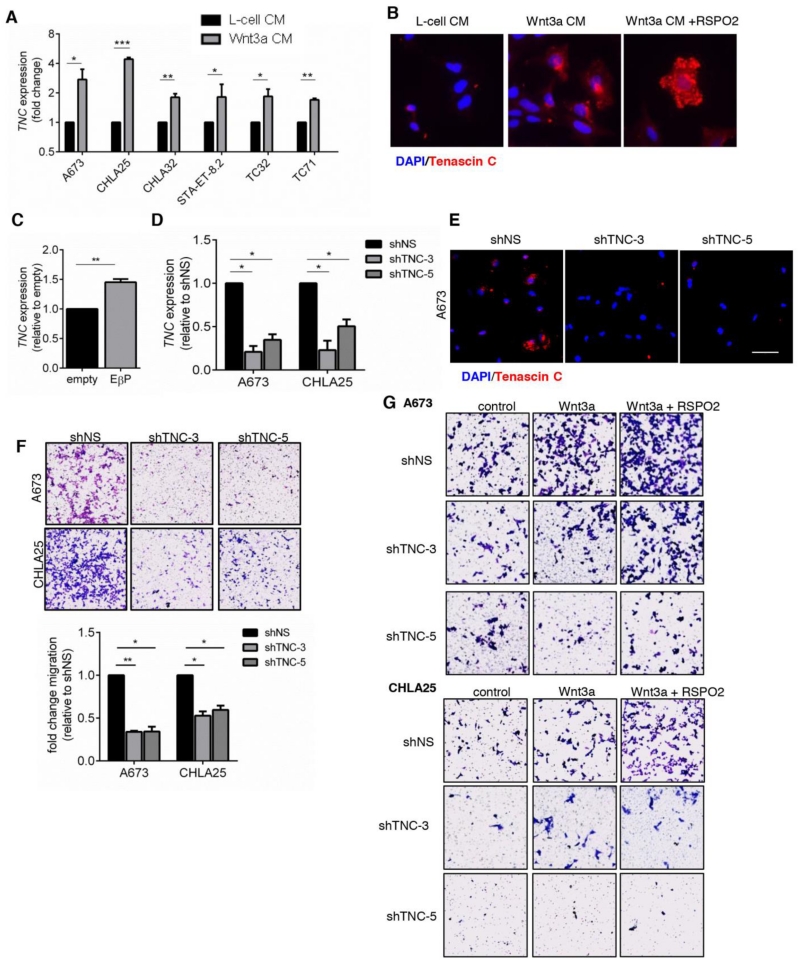
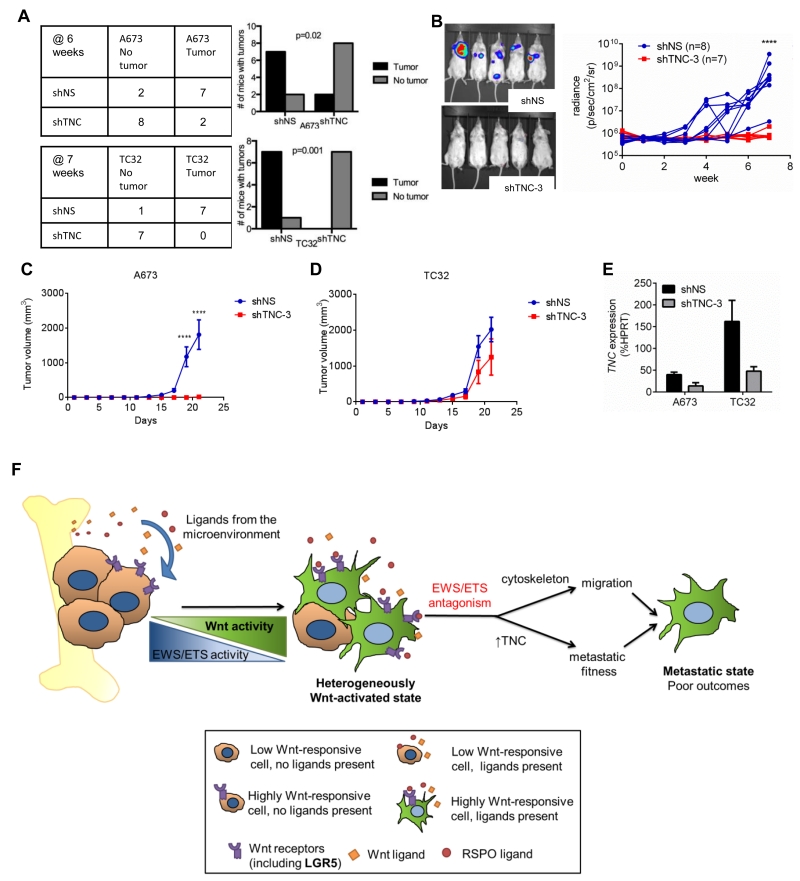
Ewing sarcomas are characterized by the presence of EWS/ETS fusion genes in the absence of other recurrent genetic alterations and mechanisms of tumor heterogeneity that contribute to disease progression remain unclear. Mutations in the Wnt/β-catenin pathway are rare in Ewing sarcoma but the Wnt pathway modulator LGR5 is often highly expressed, suggesting a potential role for the axis in tumor pathogenesis. We evaluated β-catenin and LGR5 expression in Ewing sarcoma cell lines and tumors and noted marked intra- and inter-tumor heterogeneity. Tumors with evidence of active Wnt/β-catenin signaling were associated with increased incidence of tumor relapse and worse overall survival. Paradoxically, RNA sequencing revealed a marked antagonism of EWS/ETS transcriptional activity in Wnt/β-catenin-activated tumor cells. Consistent with this, Wnt/β-catenin-activated cells displayed a phenotype that was reminiscent of Ewing sarcoma cells with partial EWS/ETS loss of function. Specifically, activation of Wnt/β-catenin induced alterations to the actin cytoskeleton, acquisition of a migratory phenotype, and upregulation of EWS/ETS-repressed genes. Notably, activation of Wnt/β-catenin signaling led to marked induction of tenascin C (TNC), an established promoter of cancer metastasis, and an EWS/ETS-repressed target gene. Loss of TNC function in Ewing sarcoma cells profoundly inhibited their migratory and metastatic potential. Our studies reveal that heterogeneous activation of Wnt/β-catenin signaling in subpopulations of tumor cells contributes to phenotypic heterogeneity and disease progression in Ewing sarcoma. Significantly, this is mediated, at least in part, by inhibition of EWS/ETS fusion protein function that results in derepression of metastasis-associated gene programs. Cancer Res; 76(17); 5040-53. ©2016 AACR.


Figures

Figure 1
Figure 1. Heterogeneity of Wnt/beta-catenin activation in Ewing sarcoma
A) Cells were stained with anti-beta catenin antibody (red) and counterstained with DAPI (blue) after exposure to control (L-cell) conditioned media (CM). Nuclear beta-catenin is absent. B) After 48hr exposure to Wnt3a, some cells have strong nuclear localization of beta catenin (arrows) while others have weak or no nuclear localization (arrowheads). Scale bars = 20 μm. C) 7TGP-transduced TCF-reporter cells were stimulated with L-cell, Wnt3a CM, or Wnt3a CM +RSPO2 and GFP+ cells quantified. Heterogeneity of GFP was evident between and within cell lines. Mean ± SEM of 3 independent experiments *p<0.05, **p<0.01 ***p<0.001, ****p<0.0001. D) AQUA of a Ewing sarcoma TMA detected nuclear beta-catenin expression in a minority of tumors. Z-score: z=(sample – mean)/standard deviation. E) Left: representative beta-catenin (red) positive tumor. CD99 (green) marks tumor cells (Magnification=200×). Right: 400× image of another positive biopsy shows beta-catenin positive cells adjacent to beta-catenin negative cells. F) In situ hybridization of LGR5 in a primary Ewing sarcoma. Positive cells are noted by arrows. Scale bar = 20 μm. G) Quantification of LGR5 expression by SQUISH detected transcript expression in a minority of tumors. Z-score: z=(sample – mean)/standard deviation. H) Expression of nuclear beta-catenin and LGR5 is highly correlated. r=Pearson’s correlation. Tumors with a z-score > 1 for both beta-catenin and LGR5 are circled.
Figure 2
Figure 2. High LEF1 expression is associated with poor outcomes in Ewing sarcoma
A) Ewing sarcoma cells were transduced with a constitutively active beta-catenin construct (EβP), and expression of AXIN2, LGR5 and LEF1 was assessed by qRT-PCR. B) LEF1 gene expression in a cohort of 46 clinically annotated biopsies from patients diagnosed with localized Ewing sarcoma (GSE 63157). C) Analysis of event free and overall (D) survival shows that patients whose tumors expressed high levels of LEF1 experienced worse clinical outcomes.
Figure 3
Figure 3. Targets of Wnt/beta-catenin signaling in Ewing sarcoma are cell-type specific and oppositely regulated by EWS/ETS fusions
A) Sorting strategy to isolate Wnt/beta-catenin-activated and non-activated CHLA25-7TGP reporter cells. B) Many canonical Wnt/beta-catenin target genes identified in other cell types are not induced by Wnt in Ewing sarcoma. Conversely, established targets AXIN2, LEF1, and NKD1 are induced. Expression plotted as fold change relative to control cells. *p<0.05, **p<0.01, ***p<0.001 C) MSigDB analysis of genes that were significantly and at least 2-fold repressed (top panel) or induced (bottom panel) by Wnt/beta-catenin shows marked overlap with EWS/FLI1 target genes but genesets were inversely regulated. D) Published EWS/ERG target genes are enriched among Wnt/beta-catenin-modulated genes. Significance was determined using the Chi-square test. E) GSEA of all Wnt/beta-catenin regulated genes confirms a significant inverse relationship with EWS/FLI1 transcriptional targets. Comparisons of rank-ordered Wnt/beta-catenin-regulated genes to EWS/FLI1- repressed (top panel) and EWS/FLI1-induced (bottom panel) genes are shown. NES indicates the normalized enrichment score.
Figure 4
Figure 4. Overlap between Wnt/beta-catenin and EWS/ETS-modulated genes
A) qRT-PCR analysis of EWS/FLI1 expression in unstimulated (L-cell/GFP−) and Wnt/beta-catenin-activated cells (Wnt3a CM, Wnt3aCM/RSPO2; top 20% GFP+). *p<0.05, **p<0.01, ***p<0.001 B) Expression of EWS/FLI1 protein was assessed by Western blot in cells as in (A). A trend toward decreased EWS/FLI1 expression is seen in Wnt-active cells. C) qRT-PCR analysis of EWS/ERG expression in unstimulated (L-cell/GFP−) and Wnt/beta-catenin-activated cells (Wnt3a CM, Wnt3aCM/RSPO2; top 20% GFP+). D) Expression of EWS/ERG protein was assessed by Western blot in cells as in (C). No change is seen in Wnt-active cells. ERG densitometry values normalized to GAPDH are indicated. E) Published EWS/FLI1 target genes are enriched among Wnt/beta-catenin-modulated genes. Significance was determined using the Chi-square test. F) Hierarchical clustering and gene ontologies of 236 overlapping genes from (E).
Figure 5
Figure 5. Activation of Wnt/beta-catenin signaling induces cytoskeleton changes and promotes migration
A) Relative expression of cytoskeleton and adhesion genes that are repressed by EWS/FLI1 in Ewing sarcoma cells and induced by Wnt/beta-catenin activation. B) Assessment of F-actin filaments in 7TGP-reporter cells following exposure to Wnt3a +/− RSPO2 shows induction of stress fibers (phalloidin, red) in Wnt/beta-catenin activated (green) cells. Nuclei are counterstained with DAPI (blue). Scale bar = 20 μm. C) Transwell migration assays of control and recombinant Wnt3a/RSPO2-stimulated cells shows enhanced migration in Wnt/beta-catenin activated cells. D) Bioluminescence imaging of mice 3 weeks after tail-vein injection of L-cell CM- or Wnt3a CM+RSPO2 treated cells reveals a trend toward higher tumor burden in mice that received Wnt3a CM+RSPO2 cells. E) At 6 weeks, 5 of 10 mice that received L-cell CM-treated cells had tumors, while 9 of 10 mice that received Wnt3a CM+RSPO2-treated cells had tumors. F) None of the 5 tumors in L-cell CM-recipient mice were located in the lungs. 7 of 9 tumor-bearing mice that received Wnt-activated cells had lung tumors.
Figure 6
Figure 6. Tenascin C is a Wnt/beta-catenin target
A) qRT-PCR of TNC expression in Ewing sarcoma cells following exposure to L-cell or Wnt3a CM. Mean ± SEM of 3 biologic replicates. *p<0.05, **p<0.01, ***p<0.001. B) Tenascin C protein (red) was assessed by immunocytochemistry in CHLA25 cells following stimulation with L-cell or Wnt3a CM +/− RSPO-2. Cells were counterstained with DAPI (blue). C) qRT-PCR analysis of TNC in cells stably transduced with constitutively active beta-catenin. Mean ± SEM of 3 biologic replicates. **p<0.01. D) Knock down of TNC was achieved in Ewing sarcoma cells following stable infection with shTNC vectors (shTNC-3 and shTNC-5). Expression measured by qRT-PCR. E) Tenascin C protein expression (red) was assessed by immunocytochemistry of A673 cells as in (D). Cells were counterstained with DAPI (blue). Scale bar = 50 μm. F) Migration of TNC knockdown cells is reduced compared to control shNS cells. Three independent experiments were quantified using crystal violet and expressed as mean ± SEM relative to controls (bottom panel). *p<0.05, **p<0.01. G) TNC knockdown and control cells were stimulated with PBS (control), recombinant Wnt3a, or recombinant Wnt3a +RSPO2 and allowed to migrate for 24 hr. TNC knockdown partially inhibits Wnt-dependent migration.
Figure 7
Figure 7. Tenascin C promotes lung engraftment of Ewing sarcoma cells
A) Control and TNC knockdown A673 and TC32 cells were injected via tail vein into NOD-SCID mice and tumor growth monitored by bioluminescence imaging for 6-7 weeks. The efficiency of tumor engraftment in TNC knockdown cells was significantly impaired in both cell lines (Fisher’s exact test). B) Representative bioluminescence images and growth curves for TC32 mice as in (A). C) Control and TNC knockdown cells were injected subcutaneously and tumor growth monitored. Tumorigenicity of A673 cells was completely abrogated by TNC-knockdown. ****P<0.0001. D) Subcutaneous engraftment and growth of TC32 cells was minimally impaired by TNC knockdown. E) TNC expression determined by qRT-PCR in control and TNC-knockdown cells prior to injection into mice for studies in C & D. Basal expression of TNC was very high in TC32 cells and expression after knockdown was equivalent to that of control A673 cells. F) The antagonistic effect of Wnt/beta-catenin activation on EWS/ETS-dependent transcription results in transition of cells to a more migratory and metastatic cell state as a consequence of de-repression of cytoskeleton genes and induction of the metastasis promoter TNC. The extent of Wnt/beta-catenin activation in Ewing sarcoma cells is dependent on both the provision of Wnt-activating ligands in the tumor microenvironment and on the density of Wnt-modulating receptors, such as LGR5, that are expressed on the tumor cells themselves.

Similar articles

Cited by

References

    1. Lawlor ER, Sorensen PH. Twenty Years on: What Do We Really Know about Ewing Sarcoma and What Is the Path Forward? 2015;20(3-4):155–71. 2015-07-24. - PMC - PubMed
    1. Brohl AS, Solomon DA, Chang W, Wang J, Song Y, Sindiri S, et al. The genomic landscape of the Ewing Sarcoma family of tumors reveals recurrent STAG2 mutation. PLoS genetics. 2014 Jul;10(7):e1004475. PubMed PMID: 25010205. Pubmed Central PMCID: 4091782. Epub 2014/07/11.eng. - PMC - PubMed
    1. Crompton BD, Stewart C, Taylor-Weiner A, Alexe G, Kurek KC, Calicchio ML, et al. The genomic landscape of pediatric Ewing sarcoma. Cancer discovery. 2014 Nov;4(11):1326–41. PubMed PMID: 25186949. Epub 2014/09/05. eng. - PubMed
    1. Tirode F, Surdez D, Ma X, Parker M, Le Deley MC, Bahrami A, et al. Genomic landscape of Ewing sarcoma defines an aggressive subtype with co-association of STAG2 and TP53 mutations. Cancer discovery. 2014 Nov;4(11):1342–53. PubMed PMID: 25223734. Pubmed Central PMCID: 4264969. Epub 2014/09/17. eng. - PMC - PubMed
    1. Bennani-Baiti IM, Cooper A, Lawlor ER, Kauer M, Ban J, Aryee DN, et al. Intercohort gene expression co-analysis reveals chemokine receptors as prognostic indicators in Ewing’s sarcoma. Clinical cancer research : an official journal of the American Association for Cancer Research. 2010 Jul 15;16(14):3769–78. PubMed PMID: 20525755. Pubmed Central PMCID: 2905506. - PMC - PubMed

Publication types

MeSH terms