. 2016 Oct;26(10):1079-1098.
doi: 10.1038/cr.2016.85. Epub 2016 Jul 1.

Identification of blood vascular endothelial stem cells by the expression of protein C receptor

Affiliations

Identification of blood vascular endothelial stem cells by the expression of protein C receptor

Qing Cissy Yu et al. Cell Res. 2016 Oct.

Abstract

Vascular growth and remodeling are dependent on the generation of new endothelial cells from stem cells and the involvement of perivascular cells to maintain vessel integrity and function. The existence and cellular identity of vascular endothelial stem cells (VESCs) remain unclear. The perivascular pericytes in adult tissues are thought to arise from the recruitment and differentiation of mesenchymal progenitors during early development. In this study, we identified Protein C receptor-expressing (Procr+) endothelial cells as VESCs in multiple tissues. Procr+ VESCs exhibit robust clonogenicity in culture, high vessel reconstitution efficiency in transplantation, long-term clonal expansion in lineage tracing, and EndMT characteristics. Moreover, Procr+ VESCs are bipotent, giving rise to de novo formation of endothelial cells and pericytes. This represents a novel origin of pericytes in adult angiogenesis, reshaping our understanding of blood vessel development and homeostatic process. Our study may also provide a more precise therapeutic target to inhibit pathological angiogenesis and tumor growth.


Figures
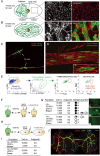
Figure 1
Figure 1
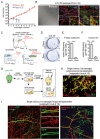
Procr-expressing endothelial cells are enriched for stem cells with regenerative capacity. (A) Illustration of pubertal mammary gland (4-week-old) and staining of endothelium (CD31) and epithelium (outlined by K14) in empty fat pad section prior to epithelial occupancy. Scale bar, 150 μm. (B) Illustration of adult mammary gland (8-week-old) and staining of blood vessel (CD31) and epithelium (K14) in section of fat pads with epithelium penetration. Scale bar, 150 μm. (C, D) Immunohistochemistry indicating the expression of Procr in both tip cells (C) and stalk cells (D). Scale bar, 50 μm. (E) FACS analysis of Procr expression in 8-week-old C57BL/6 mammary gland ECs. (F, G) Schematic illustration of subcutaneous transplantation assays. Procr+ ECs and Procr ECs were isolated from 8-week-old Actin-GFP mammary glands by FACS. The isolated ECs with GFP label were transplanted in limiting dilution into recipients under the flank skin (subcutaneous) as indicated (F). The degree of endothelial vessel outgrowth was evaluated based on the occupancy of Matrigel plug. The representative images were shown on the right. Data were pooled from five independent experiments (G). (H-J) Transplantation of sorted Procr+ vs Procr ECs in limiting dilution into the empty fat pad of 3-week-old pubertal mammary gland (H). Fat pads of recipients were harvested and the GFP+ vessel outgrowths were analyzed at 4 weeks post transplantation (I). Whole-mount confocal image indicating the integration and contribution of transplanted Procr+ ECs (GFP+) to host mammary vasculature. Endothelial cells were counterstained with CD31 (J). Scale bar, 50 μm.
Figure 2
Figure 2
Procr+ ECs have robust clonogenicity and their cultured progenies retain stem cell capacities. (A, B) Procr+ ECs and Procr ECs were sorted from 8-week-old mammary fat pads and plated in 2-D culture in equal amount. Cell numbers at each passage were quantified and displayed as mean ± SD. Data are pooled from 6 independent experiments (A). Cultured Procr+ ECs (left, bright field) showed positive uptake of Ac-LDL (middle) and positive staining for eNOS Ser1117 (right, B). Scale bar, 100 μm. (C) Cultured Procr+ ECs or Procr ECs from the first passage were subjected to FACS analysis for the expression of Procr. Procr ECs remained negative for Procr expression in culture. Procr+ ECs gave rise to majority of Procr+ cells and a small percentage of Procr cells as indicated. (D) Sorted Procr+ ECs or Procr ECs from 8-week-old CD1 mammary vasculature were cultured in semi-solid 3D methylcellulose medium. Representative pictures of formed colonies on day 7 were shown. Scale bar, 1 mm. (E, F) Quantification of colony forming frequencies of Procr+ EC or Procr EC freshly isolated from the mammary gland (E), and from cultured Procr+ ECs (F). Colony numbers were counted on day 7. Data are pooled from 3 independent experiments and displayed as mean ± SD. ***P < 0.01. (G) Schematic illustration of transplantation assays using colonies derived from single Procr+ ECs. (H) Single colonies derived from single GFP-labeled Procr+ ECs were mixed with Matrigel and subcutaneously transplanted to recipients. The outgrowths were analyzed at 3 weeks post injection by whole-mount staining with EC marker CD31. GFP+ endothelia were detected in 9 out of 10 Matrigel plugs. Scale bar, 50 μm. (I) Single colonies derived from single GFP-labeled Procr+ ECs were transplanted to empty mammary fat pads. The outgrowths were analyzed at 4 weeks post injection by whole-mount staining with EC marker CD31 (left). GFP+ endothelia were detected in 8 out of 10 fat pads. Intravenous injection in recipient mice with isolectin and the following staining indicated that the outgrowths have formed luminized vessels (right). Scale bar, 50 μm.
Figure 3
Figure 3
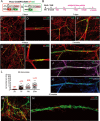
Lineage tracing of Procr+ ECs demonstrates their contribution to EC clonal expansion during development. (A) Illustration of lineage tracing strategy using ProcrCreERT2/+;R26mTmG/+ line. (B) Experimental setup used in short-term (2 days) and long-term tracing (7 days to 10 months) as indicated. (C, D) Whole-mount confocal imaging of mammary vasculature at 2 days post TAM administration showing individual GFP+ ECs on existing vasculature with zoom out (C) and zoom in (D) views. Scale bar, 50 μm. (E-H) Whole-mount confocal imaging of mammary vasculature at 7 days (E, F) and 14 days (G, H) post TAM administration indicating clonal expansion of GFP+ cells. Scale bar, 50 μm. (I-K) Whole-mount confocal imaging of mammary vasculature at 2 months post TAM administration. Staining of Cdh5 (J) and laminin (K) confirmed the EC identity of GFP+ clones. Scale bar, 50 μm. (L) Quantification of cell numbers per GFP+ clone indicating the expansion of clone sizes at 2 days, 7 days, 14 days and 2 months post TAM treatment. Data were pooled from at least 3 mice for each tracing time point and are presented as mean ± SD. (M, N) Whole-mount confocal imaging of mammary vasculature at 10 months post TAM administration.
Figure 4
Figure 4
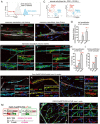
Procr+ VESCs contribute to pericyte formation. (A) FACS analysis indicating that neither all ECs (grey) nor Procr+ ECs (red) express pericyte marker NG2. Pericyte was used as a positive control for NG2 expression (blue). (B) Whole-mount immunohistochemistry of mammary vasculature confirming that Procr+ ECs (Procr+, CD31+, arrow) do not overlap with pericytes (NG2+, arrowhead). n = 206 Procr+ cells scored. Scale bar, 50 μm. (C) FACS analysis of the stromal cell compartment indicating that pericytes (blue, marked by NG2+ or Pdgfrb+) and Procr-expressing fibroblasts (red) are distinct populations. (D) Whole-mount analysis of mammary vasculature at 2 days post TAM induction showing a GFP+ EC (arrow) and GFP pericytes (arrowheads). Scale bar, 50 μm. (E, F) Whole-mount analysis of mammary vasculature at 2 months post TAM induction showing that a GFP+ clone consisted of both ECs (CD31+) and pericytes marked by NG2 (arrowheads in E) or Desmin (arrowheads in F). Scale bar, 50 μm. (G) Quantification of the percentage of clones containing GFP+ pericytes. 16.1% of clones contained GFP+pericyte at 2 months of tracing, and the percentage increased to 32.1% at 10 months of tracing. Data are presented as mean ± SD. Data were pooled from at least 3 mice for each tracing time point. (H, I) Quantification of GFP+ ECs and GFP+ pericytes in the mammary gland by FACS analysis, indicating the growing percentage of GFP+ ECs (H) and GFP+ pericytes (I) as tracing period prolongs. (J-L) Whole-mount confocal images indicating that CFP (J), YFP (K) or RFP (L) labeled clone consisted of both ECs (CD31+) and pericytes (αSMA+ or NG2+) after 1-2 months of tracing. CFP, cyan fluorescent protein; RFP, red fluorescent protein; YFP, yellow fluorescent protein. Scale bar, 50 μm. (M) Illustration of lineage tracing strategy using Cdh5-CreERT2;R26mTmG/+ line and experimental setup used. (N) Whole-mount confocal image of Cdh5-CreERT2;R26mTmG/+ mammary vasculature at 4 weeks post TAM administration. Boxed area showed GFP+ pericytes (arrowheads, NG2+ cells) within GFP+ endothelial clones. Scale bar, 50 mm.
Figure 5
Figure 5
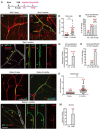
Procr+ VESCs contribute to both EC and pericyte formation in the skin and retina vasculature. (A) Experimental setup used in skin and retina vasculature lineage tracing. (B, C) Whole-mount confocal imaging of the abdominal skin vasculature showing individual GFP+ cells at 2 days after TAM administration (B), and GFP+ clones at 2 months after TAM induction (C). Scale bar, 100 μm. (D) Quantification of cell numbers per GFP+ clone at each time point indicating the expansion of clone sizes. (E) FACS analysis indicating the increasing percentage of GFP+ECs. (F) At 2 months post TAM induction, the clones contained pericytes marked by Desmin (Des; arrowheads). Scale bar, 100 μm. (G) Quantification of the percentage of GFP+ clones that contained GFP+ pericytes. No clones contained GFP+pericyte at 2 days of tracing, and the percentage increased to 21.73% at 2 months of tracing. (H) FACS quantification confirmed the increasing percentage of GFP+ pericytes as tracing period prolongs. Data were pooled from at least 3 mice for each tracing time point and are presented as mean ± SD. (I, J) Whole-mount confocal imaging of the retina vasculature showing individual GFP+ cells at 2 days after TAM administration (I), and GFP+ clones at 2 months after TAM induction (J). Scale bar, 50 μm. (K) Quantification of cell numbers per GFP+ clone at each time point indicating the expansion of clone sizes. (L) At 2 months post TAM administration, the GFP+ clones contained pericytes marked by NG2 (arrowhead). Scale bar, 50 μm. (M) Quantification of the percentage of GFP+ clones that contained GFP+ pericytes. When analyzed in all area, no clones contained GFP+pericyte at 2 days of tracing, and the percentage increased to 6.8% at 2 months of tracing. Data were pooled from at least 3 mice for each tracing time point and are presented as mean ± SD.
Figure 6
Figure 6
Procr+ VESCs are crucial for vascular development and regeneration. (A-C) Targeted ablation of Procr+ cells delays retina blood vessel development. ProcrCreERT2/+;R26DTA/+ mice and R26DTA/+ mice (Ctrl) were TAM administered at postnatal day 1.5 and retinas were harvested on day 6 as illustrated (A). The whole-mount view of entire retinal vascular occupancy as well as zoom-in view of vascular structure were visualized by CD31 whole-mount staining (B, C). Scale bar, 500 μm. (D-J) Mice were subjected to femoral artery ligation followed by intramuscular injection with Procr+ECs or Procr ECs isolated from Actin-RFP mice on day 2. Representative laser-Doppler perfusion imaging of mice on day 2 (E) and day 23 (F, G) after hind limb ischemia is shown. Quantification of blood flow recovery was calculated from > 3 mice/group (n = 3 in Procr EC group, n = 5 in Procr+ EC group). Data are presented as mean ± SD. ***P < 0.01 (H). Whole-mount microscopy image visualizing the formation of RFP+ vessel in mice receiving Procr+ EC injection on day 23 (I). Confocal image confirming that these RFP+ vessels are connected to the systemic circulation as evidenced by isolectin staining (J). Scale bar, 50 μm.
Figure 7
Figure 7
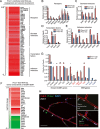
Procr+ VESCs have higher expression of angiogenic genes and display EndMT molecular signature. (A) RNA-seq analysis indicating upregulation of angiogenesis- and vascular development-related genes in Procr+ ECs compared to Procr ECs. (B-E) qPCR validation of RNA-seq results, including cell surface receptors (B), secreted molecules (C), transcription factors (D), and adhesion molecules (E) that are involved in angiogenesis and vascular development. (F) RNA-seq analysis indicating upregulation of characteristic genes of EndMT and EMT in Procr+ VESCs. (G) qPCR validation of RNA-seq results showing higher expression of typical EndMT- and EMT-related genes in Procr+ VESCs compared to Procr ECs. (H) Whole-mount confocal analysis of mammary vasculature showing Zeb1 staining on perivascular cells (arrows, Cdh5) and Zeb1 staining on Procr+ VESC (Cdh5+, Procr) as well (green arrowhead). Scale bar, 50 μm.

Comment in

References

    1. Diaz-Flores L, Gutierrez R, Varela H, Rancel N, Valladares F. Microvascular pericytes: a review of their morphological and functional characteristics. Histol Histopathol 1991; 6:269–286. - PubMed
    1. Hall CN, Reynell C, Gesslein B, et al. Capillary pericytes regulate cerebral blood flow in health and disease. Nature 2014; 508:55–60. - PMC - PubMed
    1. Pallone TL, Silldorff EP. Pericyte regulation of renal medullary blood flow. Exp Nephrol 2001; 9:165–170. - PubMed
    1. Hellström M, Gerhardt H, Kalén M, et al. Lack of pericytes leads to endothelial hyperplasia and abnormal vascular morphogenesis. J Cell Biol 2001; 153:543–553. - PMC - PubMed
    1. Lindahl P, Johansson BR, Leveen P, Betsholtz C. Pericyte loss and microaneurysm formation in PDGF-B-deficient mice. Science 1997; 277:242–245. - PubMed

MeSH terms