

MNK Inhibition Disrupts Mesenchymal Glioma Stem Cells and Prolongs Survival in a Mouse Model of Glioblastoma
- PMID: 27364770
- PMCID: PMC5082426
- DOI: 10.1158/1541-7786.MCR-16-0172
MNK Inhibition Disrupts Mesenchymal Glioma Stem Cells and Prolongs Survival in a Mouse Model of Glioblastoma
Abstract
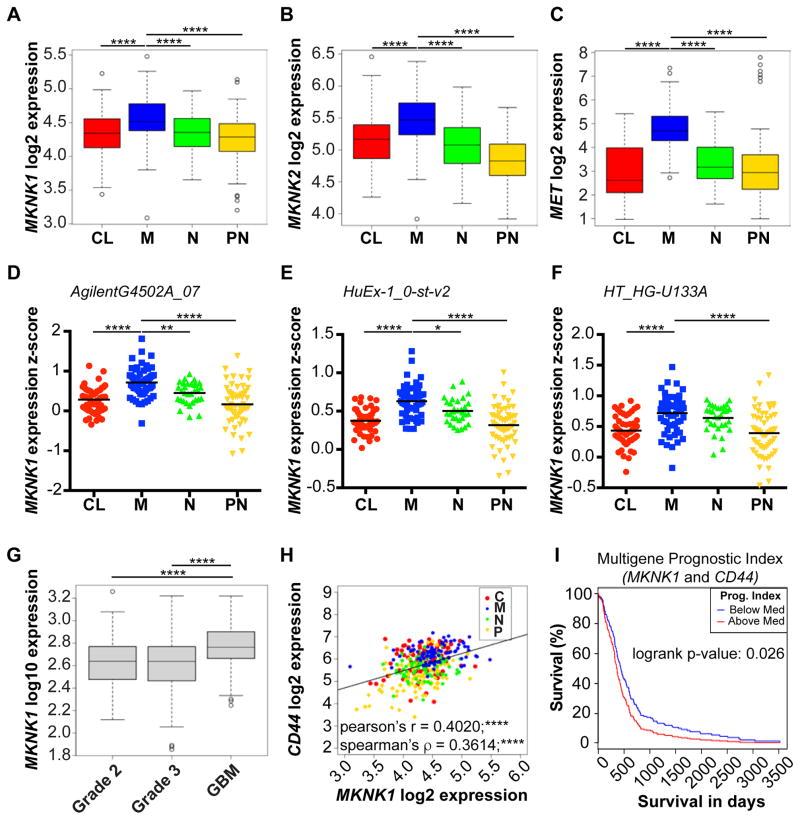
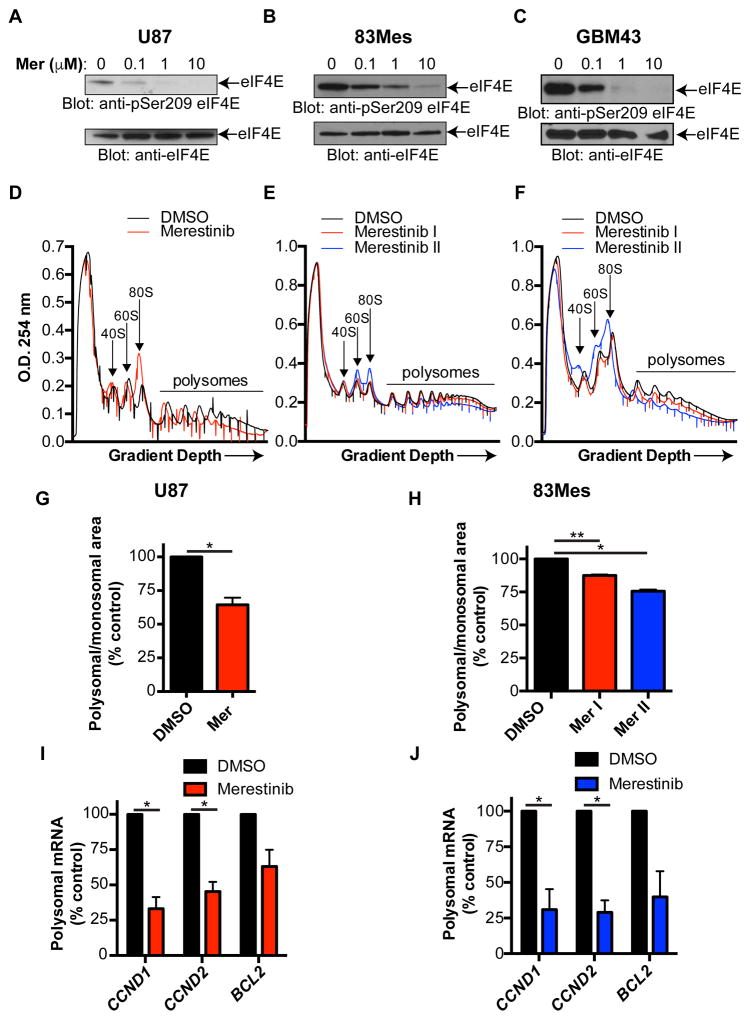
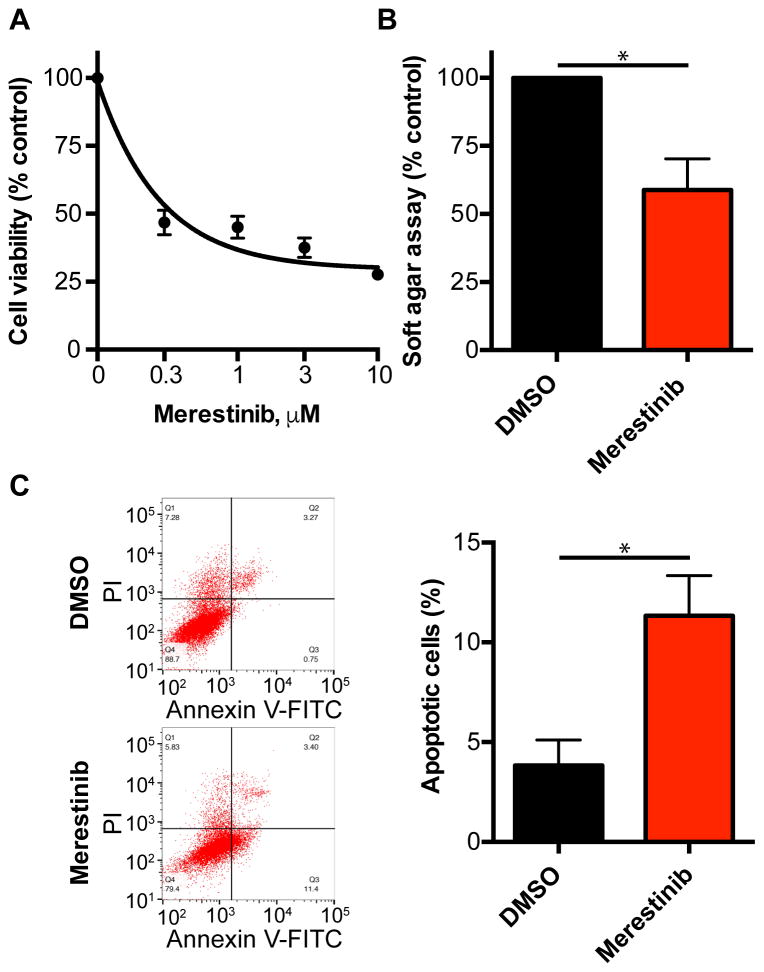
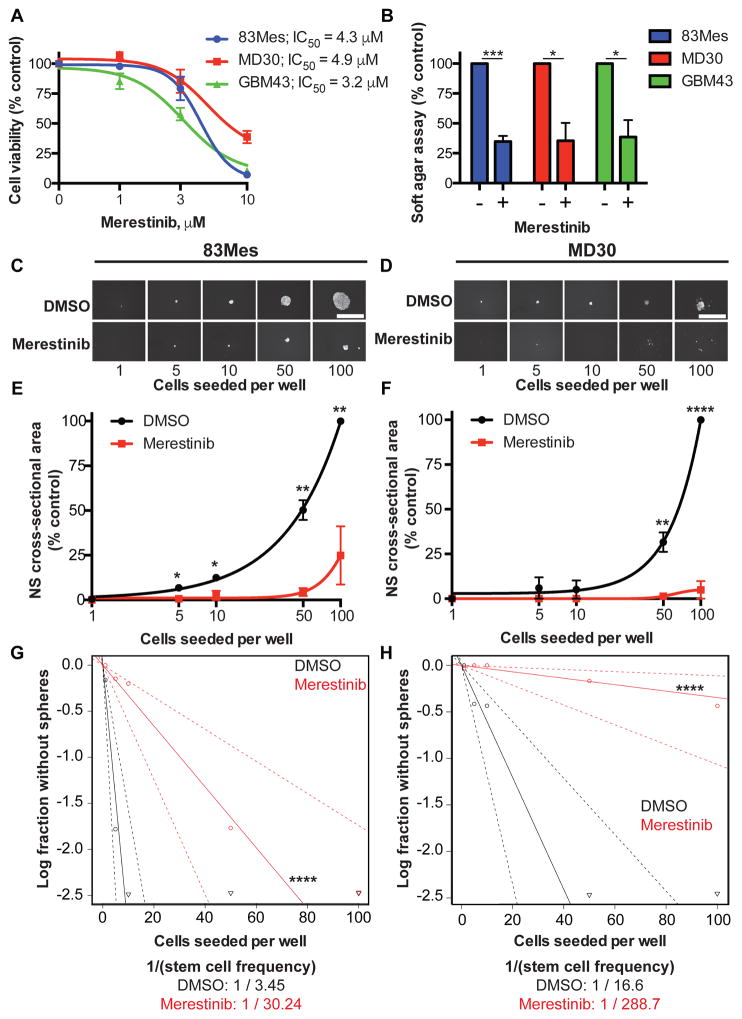
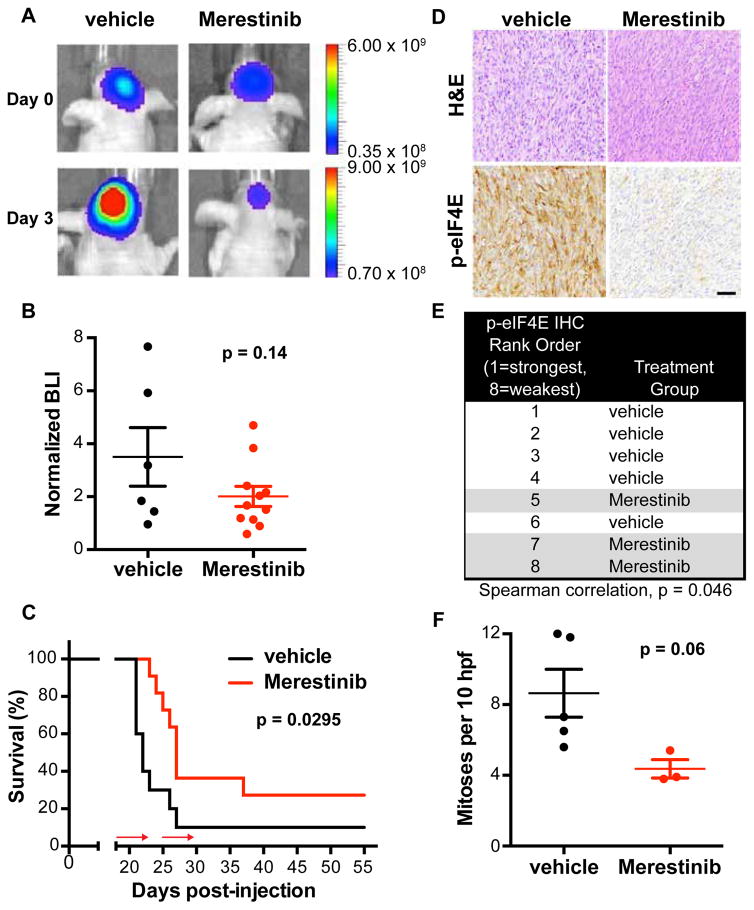
Glioblastoma multiforme remains the deadliest malignant brain tumor, with glioma stem cells (GSC) contributing to treatment resistance and tumor recurrence. We have identified MAPK-interacting kinases (MNK) as potential targets for the GSC population in glioblastoma multiforme. Isoform-level subtyping using The Cancer Genome Atlas revealed that both MNK genes (MKNK1 and MKNK2) are upregulated in mesenchymal glioblastoma multiforme as compared with other subtypes. Expression of MKNK1 is associated with increased glioma grade and correlated with the mesenchymal GSC marker, CD44, and coexpression of MKNK1 and CD44 predicts poor survival in glioblastoma multiforme. In established and patient-derived cell lines, pharmacologic MNK inhibition using LY2801653 (merestinib) inhibited phosphorylation of the eukaryotic translation initiation factor 4E, a crucial effector for MNK-induced mRNA translation in cancer cells and a marker of transformation. Importantly, merestinib inhibited growth of GSCs grown as neurospheres as determined by extreme limiting dilution analysis. When the effects of merestinib were assessed in vivo using an intracranial xenograft mouse model, improved overall survival was observed in merestinib-treated mice. Taken together, these data provide strong preclinical evidence that pharmacologic MNK inhibition targets mesenchymal glioblastoma multiforme and its GSC population.
Implications: These findings raise the possibility of MNK inhibition as a viable therapeutic approach to target the mesenchymal subtype of glioblastoma multiforme. Mol Cancer Res; 14(10); 984-93. ©2016 AACR.
©2016 American Association for Cancer Research.
Conflict of interest statement
None
Figures
Similar articles
-
Differential Response of Glioma Stem Cells to Arsenic Trioxide Therapy Is Regulated by MNK1 and mRNA Translation.Mol Cancer Res. 2018 Jan;16(1):32-46. doi: 10.1158/1541-7786.MCR-17-0397. Epub 2017 Oct 17. Mol Cancer Res. 2018. PMID: 29042487 Free PMC article.
-
Therapeutic inhibition of MAP kinase interacting kinase blocks eukaryotic initiation factor 4E phosphorylation and suppresses outgrowth of experimental lung metastases.Cancer Res. 2011 Mar 1;71(5):1849-57. doi: 10.1158/0008-5472.CAN-10-3298. Epub 2011 Jan 13. Cancer Res. 2011. PMID: 21233335
-
Combined PDK1 and CHK1 inhibition is required to kill glioblastoma stem-like cells in vitro and in vivo.Cell Death Dis. 2014 May 8;5(5):e1223. doi: 10.1038/cddis.2014.188. Cell Death Dis. 2014. PMID: 24810059 Free PMC article.
-
Biomimetic models to examine microenvironmental regulation of glioblastoma stem cells.Cancer Lett. 2018 Aug 10;429:41-53. doi: 10.1016/j.canlet.2018.05.007. Epub 2018 May 8. Cancer Lett. 2018. PMID: 29746930 Review.
-
The role of glioma stem cells in chemotherapy resistance and glioblastoma multiforme recurrence.Expert Rev Neurother. 2015;15(7):741-52. doi: 10.1586/14737175.2015.1051968. Epub 2015 May 31. Expert Rev Neurother. 2015. PMID: 26027432 Free PMC article. Review.
Cited by
-
MNK1/NODAL Signaling Promotes Invasive Progression of Breast Ductal Carcinoma In Situ.Cancer Res. 2019 Apr 1;79(7):1646-1657. doi: 10.1158/0008-5472.CAN-18-1602. Epub 2019 Jan 18. Cancer Res. 2019. PMID: 30659022 Free PMC article.
-
Blocking tumor-intrinsic MNK1 kinase restricts metabolic adaptation and diminishes liver metastasis.Sci Adv. 2024 Sep 13;10(37):eadi7673. doi: 10.1126/sciadv.adi7673. Epub 2024 Sep 13. Sci Adv. 2024. PMID: 39270021 Free PMC article.
-
An optimized MNK1b aptamer, apMNKQ2, and its potential use as a therapeutic agent in breast cancer.Mol Ther Nucleic Acids. 2022 Nov 15;30:553-568. doi: 10.1016/j.omtn.2022.11.009. eCollection 2022 Dec 13. Mol Ther Nucleic Acids. 2022. PMID: 36457699 Free PMC article.
-
Differential Response of Glioma Stem Cells to Arsenic Trioxide Therapy Is Regulated by MNK1 and mRNA Translation.Mol Cancer Res. 2018 Jan;16(1):32-46. doi: 10.1158/1541-7786.MCR-17-0397. Epub 2017 Oct 17. Mol Cancer Res. 2018. PMID: 29042487 Free PMC article.
-
Association between microRNAs 10b/21/34a and acute toxicity in glioblastoma patients treated with radiotherapy and temozolomide.Sci Rep. 2022 May 7;12(1):7505. doi: 10.1038/s41598-022-11445-9. Sci Rep. 2022. PMID: 35525840 Free PMC article.
References
-
- Omuro A, DeAngelis LM. Glioblastoma and other malignant gliomas: a clinical review. JAMA. 2013;310:1842–50. - PubMed
-
- Stupp R, Mason WP, van den Bent MJ, Weller M, Fisher B, Taphoorn MJ, et al. Radiotherapy plus concomitant and adjuvant temozolomide for glioblastoma. N Engl J Med. 2005;352:987–96. - PubMed
-
- Singh SK, Clarke ID, Terasaki M, Bonn VE, Hawkins C, Squire J, et al. Identification of a cancer stem cell in human brain tumors. Cancer Res. 2003;63:5821–8. - PubMed
-
- Ignatova TN, Kukekov VG, Laywell ED, Suslov ON, Vrionis FD, Steindler DA. Human cortical glial tumors contain neural stem-like cells expressing astroglial and neuronal markers in vitro. Glia. 2002;39:193–206. - PubMed
MeSH terms
Substances
Grants and funding
- R01 CA121192/CA/NCI NIH HHS/United States
- R01 CA077816/CA/NCI NIH HHS/United States
- I01 CX000916/CX/CSRD VA/United States
- R01 NS095634/NS/NINDS NIH HHS/United States
- T32 CA009560/CA/NCI NIH HHS/United States
- R21 CA209345/CA/NCI NIH HHS/United States
- P30 CA010815/CA/NCI NIH HHS/United States
- R01 LM011297/LM/NLM NIH HHS/United States
- R01 CA161796/CA/NCI NIH HHS/United States
- R01 CA155566/CA/NCI NIH HHS/United States
- UL1 TR001422/TR/NCATS NIH HHS/United States
- P30 CA060553/CA/NCI NIH HHS/United States
- R01 CA159811/CA/NCI NIH HHS/United States
- R01 NS093843/NS/NINDS NIH HHS/United States
- T32 CA070085/CA/NCI NIH HHS/United States
- T32 GM008152/GM/NIGMS NIH HHS/United States
LinkOut - more resources
Full Text Sources
Other Literature Sources
Medical
Molecular Biology Databases
Research Materials
Miscellaneous
