. 2016 Jun 30;13(1):174.
doi: 10.1186/s12974-016-0632-5.

Infiltrating T lymphocytes reduce myeloid phagocytosis activity in synucleinopathy model

Affiliations

Infiltrating T lymphocytes reduce myeloid phagocytosis activity in synucleinopathy model

Annika Sommer et al. J Neuroinflammation. .

Abstract

Background: Synucleinopathies comprise a group of neurodegenerative diseases associated with abnormal accumulation of α-synuclein. One of the key factors that contribute to the progression of synucleinopathies is neuroinflammation. However, the role of lymphocytes in synucleinopathies like Parkinson's disease (PD) remains largely unclear.

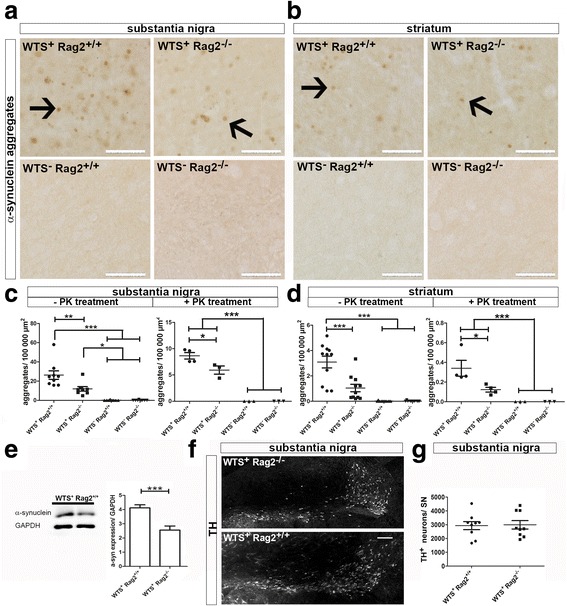
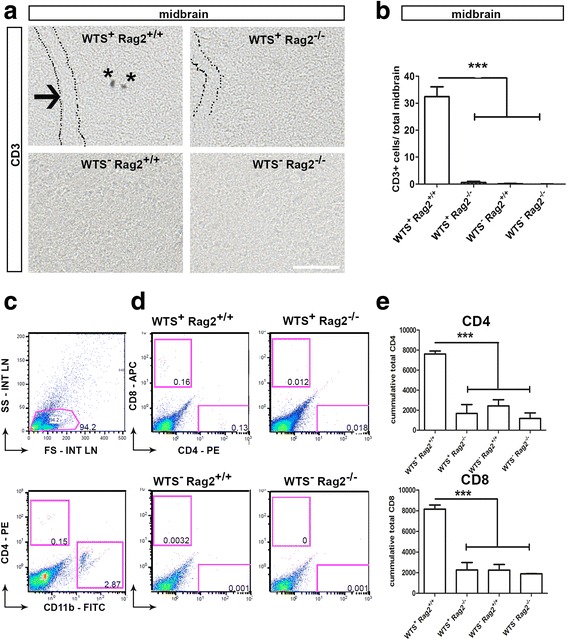
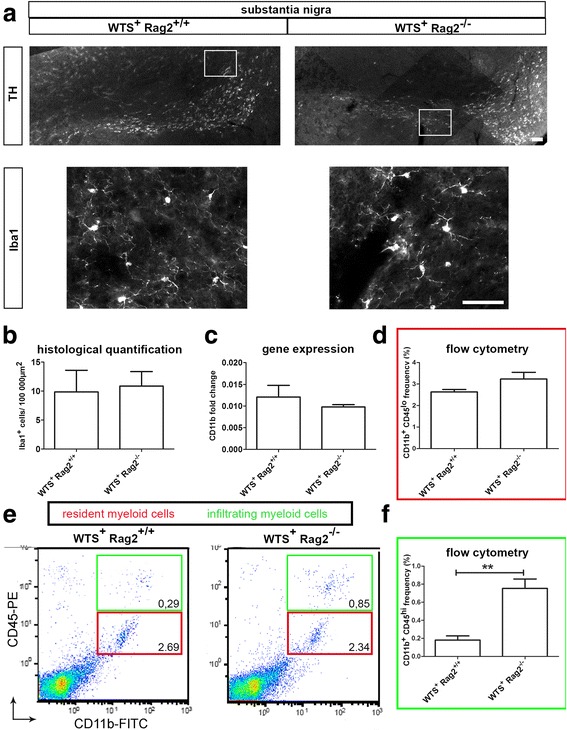
Methods: To investigate how lymphocytes impact synucleinopathies, human wild-type α-synuclein (WTS) transgenic mice were crossed with mice lacking mature lymphocytes (Rag2(-/-)). In this in vivo model, we quantified α-synuclein aggregation in the substantia nigra (SN) and striatum and determined the numbers of innate and adaptive immune cells in the central nervous system (CNS). The activation state of resident and infiltrated CNS myeloid cells (M1 vs. M2) was further classified by gene and protein expression analyses. The impact of T and B lymphocytes on the phagocytic activity of microglia in the presence of α-synuclein aggregates was addressed in BV2 microglia in vitro.

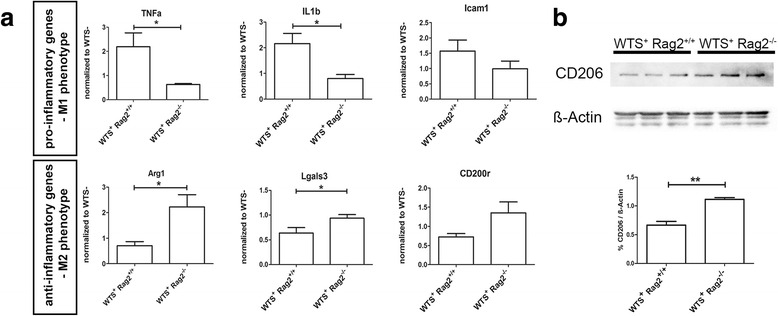
Results: Compared to WTS(+) Rag2(+/+) mice, where T but not B lymphocytes infiltrated the CNS, decreased amounts of α-synuclein aggregates were found in WTS(+) Rag2(-/-) mice devoid of mature lymphocytes. The presence of T lymphocytes did not alter the number of Iba1(+) microglia but increased the frequency of the CD11b(+) CD45(hi) population in the CNS, indicative of an increased number of infiltrated macrophages. Moreover, the M1 phenotype was more prominent in WTS(+) Rag2(+/+) mice, whereas the M2 activation state was dominating in the absence of lymphocytes in WTS(+) Rag2(-/-) mice. In vitro, in the presence of T but not B lymphocytes, significantly less α-synuclein was phagocytosed by BV2 microglia, further supporting the prevalence of the M1 phenotype in the presence of T lymphocytes.

Conclusions: Peripheral T lymphocytes strongly contribute to increased α-synuclein pathology via modulation of CNS myeloid cell function. In the presence of T lymphocytes, microglia phagocytosis of aggregated α-synuclein is reduced, which increases the severity of synucleinopathy.

Keywords: Adaptive immune system; Parkinson’s disease; Rag2; mThy1 WTS model.


Figures

Fig. 1
Fig. 1
Increased numbers of α-synuclein in the presence of lymphocytes. a, b Representative bright field pictures of the a substantia nigra and b striatum show α-synuclein aggregates in WTS+ Rag2+/+ and WTS+ Rag2−/− but not in WTS mouse brains. α-synuclein was stained in the brain tissue of 22–26-week-old mice using anti-α-synuclein (15G7) antibody. Scale bars 100 μm. Arrows indicate α-synuclein aggregates determined as brown spots of at least 3 μm in diameter and are shown by arrows. c, d Significantly reduced numbers of α-synuclein aggregates were found in WTS+ Rag2−/− compared to WTS+ Rag2+/+ mice in both the substantia nigra and striatum without and with proteinase K (PK) treatment. Control mice (WTS) did not show any aggregates. T-test **p < 0.01, ***p < 0.001. e The protein level of α-synuclein was determined by western blotting indicating increased amount of α-synuclein protein in WTS+ Rag2+/+ mice compared to WTS+ Rag2−/− mice (n = 3 per group). f WTS+ Rag2+/+ and WTS+ Rag2−/− brains were stained for the dopaminergic neuronal marker tyrosine hydroxylase (TH), and representative pictures of the substantia nigra are shown. g No significant difference in the number of TH+ neurons could be detected by stereological quantification in the SN of WTS+ Rag2+/+ compared to WTS+ Rag2−/− mice. Scale bar 50 μm. c, d, g Data from nine to ten (five for WTS) mice/group are shown
Fig. 2
Fig. 2
CD3+ lymphocytes infiltrate the midbrain of WTS+ Rag2+/+ mice. a WTS+ Rag2+/+ and WTS+ Rag2−/− as well as WTS brains were stained for the T lymphocyte marker CD3 as shown in representative bright field pictures of the midbrain and the quantification in b. Infiltrating CD3+ lymphocytes, labeled with asterisks, do not co-localize with blood vessels (indicated by the dotted lines). CD3+ cells were only present in WTS+ Rag2+/+ mice, but not in WTS+ Rag2−/− or WTS mice. Scale bar 50 μm. b Data from five mice/group are shown. c–e Flow cytometry analysis of the brain tissues was performed to confirm the presence and to analyze the subsets of T lymphocytes in WTS+ Rag2+/+ mice. c 30,000 events were recorded, and a total population was defined in the forward/side scatter, excluding dead cells, which were identified by utilizing a live-dead staining, for further gating strategies (upper histogram). The CD4+ (CD11b) population representing CD4+ T lymphocytes and distinguished from CD4 low positive CD11b+ microglia population is shown in a representative dot plot (lower histogram). Representative scatter and dot plot are shown from brain tissue of a WTS+ Rag2+/+ mouse. d Gated populations for the T lymphocyte subset markers CD4 (T helper cell) and CD8 (cytotoxic T cell) are visualized in representative dot plots, and total cell numbers of CD4 and CD8 T cells per group ± SEM are shown in e, which were determined based on bead measurement and calculation of the total cell number. Significantly more CD4+ and CD8+ T cells are present in WTS+ Rag2+/+ compared to WTS+ Rag2−/− and WTS mouse brain tissues. Data from five mice/group are shown. T-test, *p < 0.05, ***p < 0.001
Fig. 3
Fig. 3
Increased presence of infiltrating myeloid cells in brains of WTS+ Rag2−/− mice. a Representative fluorescence pictures of the substantia nigra (SN) of WTS+ Rag2+/+ and WTS+ Rag2−/− mice stained for TH+ neurons to visualize the SN (upper panel) and for Iba1 to visualize CNS myeloid cells in the SN (lower panel). Scale bars 50 μm. The total number of b Iba1+ myeloid cells in the SN, c CD11b mRNA expression measured by qRT-PCR and d CD11b+ CD45lo cell frequency measured by flow cytometry (total of 30,000 recorded events, total brain cell population was defined as shown in Fig. 2c, defined as shown in the representative dot plots in e, red box) were unchanged between WTS+ Rag2+/+ and WTS+ Rag2−/− mouse brain tissues. e, f A significant increase in infiltrating myeloid cells defined as CD11b+ CD45hi population (green box in E) was found in WTS+ Rag2−/− compared to WTS+ Rag2+/+ brains in flow cytometry analysis. Data from four to five mice/group are shown as means ± SEM. T-test, **p < 0.01
Fig. 4
Fig. 4
Infiltrating T lymphocytes are associated with a M1 myeloid phenotype. a Gene expression of characteristic M1 markers (TNF-α, IL-1β, ICAM1) measured by qRT-PCR shows their upregulation in WTS+ Rag2+/+ mice compared to WTS+ Rag2−/− mice, while genes associated with an anti-inflammatory M2 phenotype (Arg1, Lgals3, CD200r) are upregulated in WTS+ Rag2−/− compared to WTS+ Rag2+/+ mice. The gene expression values in WTS+ mice were normalized to the respective gene expression levels in WTS mice. RNA was extracted from the whole-brain lysates. Data are shown as mean of five mice/group ± SEM. b The phagocytic receptor, CD206, is increased in brain tissue of WTS+ Rag2−/− compared to WTS+ Rag2+/+ mice on protein level as shown by western blot analysis with three mice/group (upper panel) and by densitometric quantification (lower panel) Data are presented as mean ± SEM
Fig. 5
Fig. 5
T lymphocytes reduce phagocytosis activity of microglia in vitro. a BV2 microglia cells were co-cultivated with aggregated α-synuclein (200nM) in absence or presence of T or B lymphocytes at the 10:1 ratio (BV2/lymphocytes) for 24 h. b Recombinant human α-synuclein was aggregated in vitro (electron microscopy picture, scale bar 0.2 μm). c α-synuclein uptake was quantified as percentage of Iba1 and α-synuclein double-positive cells within total Iba1+ population and normalized to a control uptake level in the absence of lymphocytes. α-synuclein uptake was significantly decreased in the presence of T cells, but not B cells, compared to control condition. d Co-culture of BV2 cells under the same conditions as in c with T lymphocytes isolated from WTS mice did not alter the α-synuclein uptake compared to the co-culture with T lymphocytes from WTS+ mice. Scale bar 20 μm. T-test, *p < 0.05, ***p < 0.001
Fig. 6
Fig. 6
Model of the potential contribution of T lymphocytes in synucleinopathies. In the synucleinopathy, T lymphocytes infiltrate the CNS and lead to an increase of the M1 phenotype of activated myeloid cells. The phagocytic activity of the CNS myeloid cells is thereby reduced leading to the increased presence of α-synuclein aggregates

References

    1. Braak H, et al. Staging of brain pathology related to sporadic Parkinson's disease. Neurobiol Aging. 2003;24(2):197–211. doi: 10.1016/S0197-4580(02)00065-9. - DOI - PubMed
    1. Mosley RL, et al. Neuroinflammation, oxidative stress and the pathogenesis of Parkinson’s disease. Clin Neurosci Res. 2006;6(5):261–81. doi: 10.1016/j.cnr.2006.09.006. - DOI - PMC - PubMed
    1. Dauer W, Przedborski S. Parkinson's disease: mechanisms and models. Neuron. 2003;39(6):889–909. doi: 10.1016/S0896-6273(03)00568-3. - DOI - PubMed
    1. Kawamoto H, Minato N. Myeloid cells. Int J Biochem Cell Biol. 2004;36(8):1374–9. doi: 10.1016/j.biocel.2004.01.020. - DOI - PubMed
    1. Prinz M, Priller J. Microglia and brain macrophages in the molecular age: from origin to neuropsychiatric disease. Nat Rev Neurosci. 2014;15(5):300–12. doi: 10.1038/nrn3722. - DOI - PubMed

Publication types

MeSH terms