

Fatty acid oxidation is required for the respiration and proliferation of malignant glioma cells
- PMID: 27365097
- PMCID: PMC5193020
- DOI: 10.1093/neuonc/now128
Fatty acid oxidation is required for the respiration and proliferation of malignant glioma cells
Abstract
Background: Glioma is the most common form of primary malignant brain tumor in adults, with approximately 4 cases per 100 000 people each year. Gliomas, like many tumors, are thought to primarily metabolize glucose for energy production; however, the reliance upon glycolysis has recently been called into question. In this study, we aimed to identify the metabolic fuel requirements of human glioma cells.
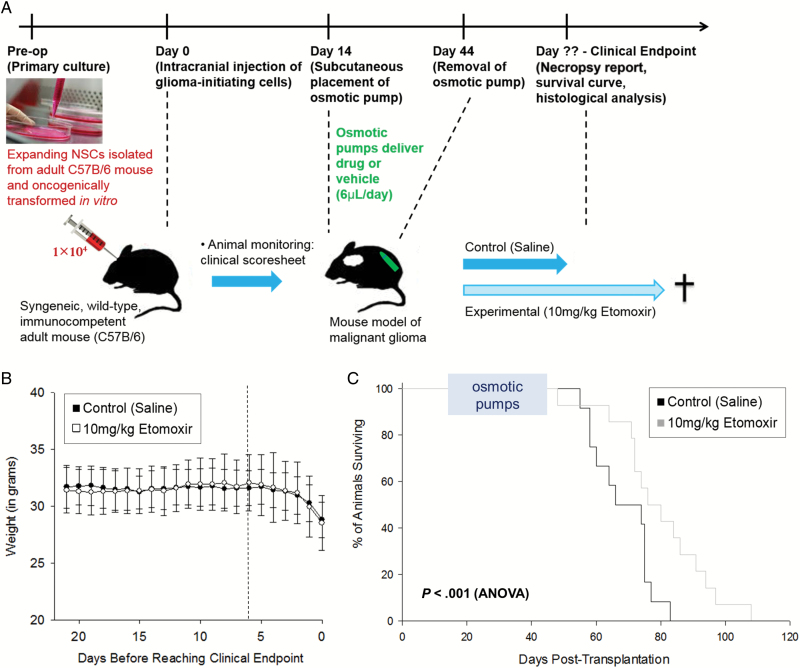
Methods: We used database searches and tissue culture resources to evaluate genotype and protein expression, tracked oxygen consumption rates to study metabolic responses to various substrates, performed histochemical techniques and fluorescence-activated cell sorting-based mitotic profiling to study cellular proliferation rates, and employed an animal model of malignant glioma to evaluate a new therapeutic intervention.
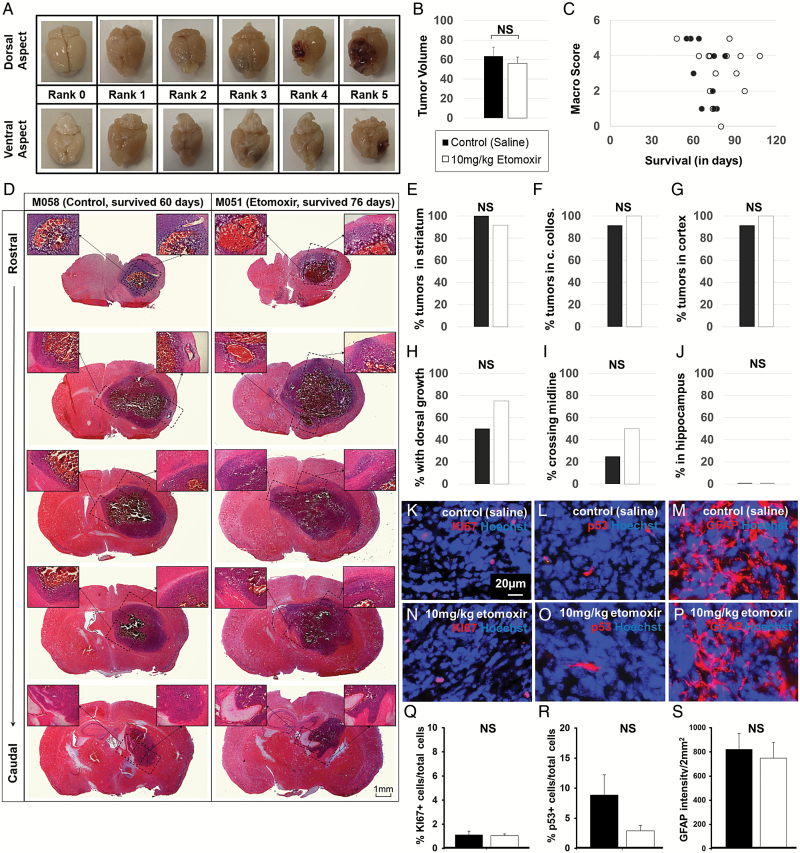
Results: We observed the presence of enzymes required for fatty acid oxidation within human glioma tissues. In addition, we demonstrated that this metabolic pathway is a major contributor to aerobic respiration in primary-cultured cells isolated from human glioma and grown under serum-free conditions. Moreover, inhibiting fatty acid oxidation reduces proliferative activity in these primary-cultured cells and prolongs survival in a syngeneic mouse model of malignant glioma.
Conclusions: Fatty acid oxidation enzymes are present and active within glioma tissues. Targeting this metabolic pathway reduces energy production and cellular proliferation in glioma cells. The drug etomoxir may provide therapeutic benefit to patients with malignant glioma. In addition, the expression of fatty acid oxidation enzymes may provide prognostic indicators for clinical practice.
Keywords: etomoxir; fatty acid oxidation; glioblastoma; glioma; metabolism.
© The Author(s) 2016. Published by Oxford University Press on behalf of the Society for Neuro-Oncology.
Figures


Similar articles
-
Inhibition of fatty acid oxidation by etomoxir impairs NADPH production and increases reactive oxygen species resulting in ATP depletion and cell death in human glioblastoma cells.Biochim Biophys Acta. 2011 Jun;1807(6):726-34. doi: 10.1016/j.bbabio.2010.10.022. Biochim Biophys Acta. 2011. PMID: 21692241
-
MET Inhibition Elicits PGC1α-Dependent Metabolic Reprogramming in Glioblastoma.Cancer Res. 2020 Jan 1;80(1):30-43. doi: 10.1158/0008-5472.CAN-19-1389. Epub 2019 Nov 6. Cancer Res. 2020. PMID: 31694905 Free PMC article.
-
A novel drug conjugate, NEO212, targeting proneural and mesenchymal subtypes of patient-derived glioma cancer stem cells.Cancer Lett. 2016 Feb 28;371(2):240-50. doi: 10.1016/j.canlet.2015.11.040. Epub 2015 Dec 9. Cancer Lett. 2016. PMID: 26683773
-
New advances of microRNAs in glioma stem cells, with special emphasis on aberrant methylation of microRNAs.J Cell Physiol. 2014 Sep;229(9):1141-7. doi: 10.1002/jcp.24540. J Cell Physiol. 2014. PMID: 24374932 Review.
-
The role of mitochondria in glioma pathophysiology.Mol Neurobiol. 2010 Aug;42(1):64-75. doi: 10.1007/s12035-010-8133-5. Epub 2010 Apr 24. Mol Neurobiol. 2010. PMID: 20414816 Review.
Cited by
-
Dual role of pseudogene TMEM198B in promoting lipid metabolism and immune escape of glioma cells.Oncogene. 2022 Sep;41(40):4512-4523. doi: 10.1038/s41388-022-02445-0. Epub 2022 Aug 29. Oncogene. 2022. PMID: 36038663
-
Chrysomycin A Reshapes Metabolism and Increases Oxidative Stress to Hinder Glioblastoma Progression.Mar Drugs. 2024 Aug 29;22(9):391. doi: 10.3390/md22090391. Mar Drugs. 2024. PMID: 39330272 Free PMC article.
-
Fatty acid oxidation fuels glioblastoma radioresistance with CD47-mediated immune evasion.Nat Commun. 2022 Mar 21;13(1):1511. doi: 10.1038/s41467-022-29137-3. Nat Commun. 2022. PMID: 35314680 Free PMC article.
-
The "Superoncogene" Myc at the Crossroad between Metabolism and Gene Expression in Glioblastoma Multiforme.Int J Mol Sci. 2023 Feb 20;24(4):4217. doi: 10.3390/ijms24044217. Int J Mol Sci. 2023. PMID: 36835628 Free PMC article. Review.
-
Disruption of peroxisome proliferator-activated receptor γ coactivator (PGC)-1α reverts key features of the neoplastic phenotype of glioma cells.J Biol Chem. 2019 Mar 1;294(9):3037-3050. doi: 10.1074/jbc.RA118.006993. Epub 2018 Dec 21. J Biol Chem. 2019. PMID: 30578297 Free PMC article.
References
-
- Ohgaki H, Kleihues P. Population-based studies on incidence, survival rates, and genetic alterations in astrocytic and oligodendroglial gliomas. J Neuropathol Exp Neurol. 2005;64 (6):479–489. - PubMed
-
- Cairns RA, Harris IS, Mak TW. Regulation of cancer cell metabolism. Nat Rev Cancer. 2011;11 (2):85–95. - PubMed
Publication types
MeSH terms
Substances
Grants and funding
LinkOut - more resources
Full Text Sources
Other Literature Sources
Medical
