. 2016 Sep 1:508:97-103.
doi: 10.1016/j.ab.2016.06.025. Epub 2016 Jun 27.

Determination of half-maximal inhibitory concentration using biosensor-based protein interaction analysis

Affiliations

Determination of half-maximal inhibitory concentration using biosensor-based protein interaction analysis

Senem Aykul et al. Anal Biochem. .

Abstract

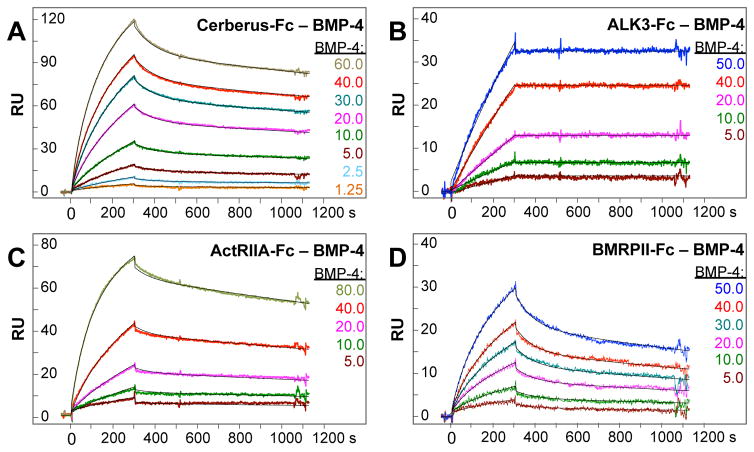
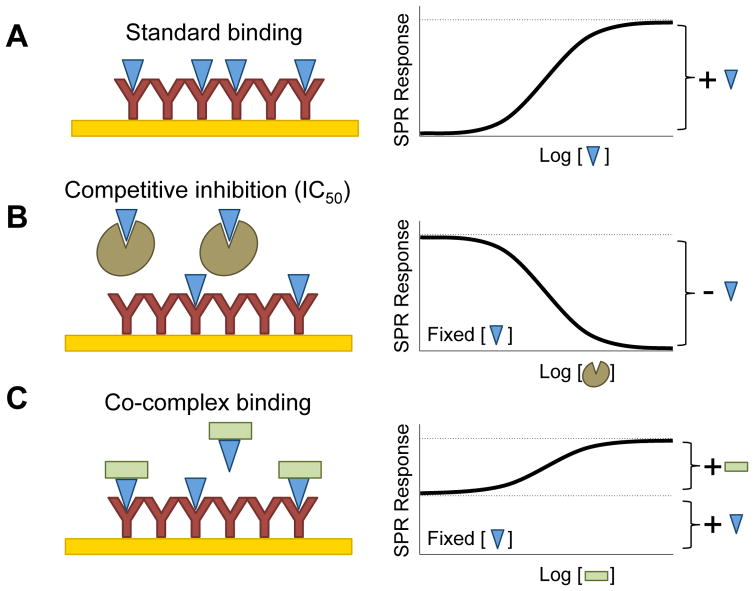
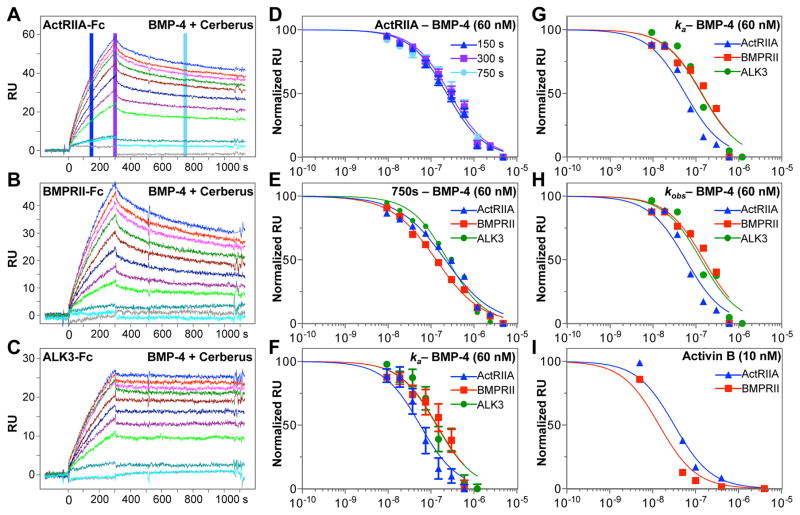
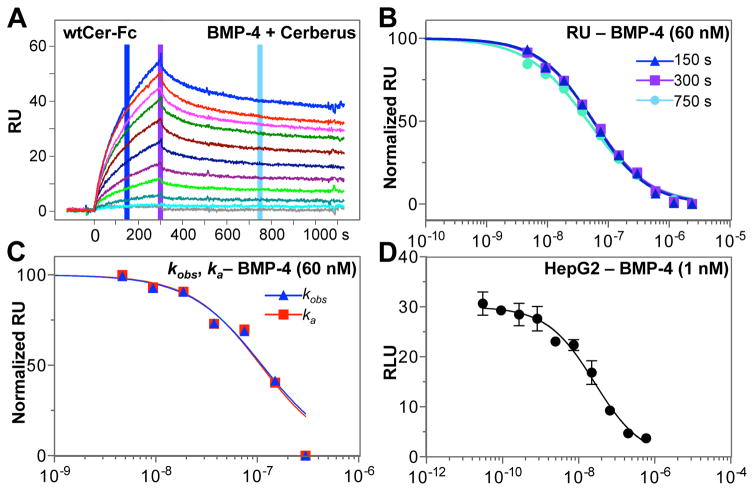
Half-maximal inhibitory concentration (IC50) is the most widely used and informative measure of a drug's efficacy. It indicates how much drug is needed to inhibit a biological process by half, thus providing a measure of potency of an antagonist drug in pharmacological research. Most approaches to determine IC50 of a pharmacological compound are based on assays that utilize whole cell systems. While they generally provide outstanding potency information, results can depend on the experimental cell line used and may not differentiate a compound's ability to inhibit specific interactions. Here we show using the secreted Transforming Growth Factor-β (TGF-β) family ligand BMP-4 and its receptors as example that surface plasmon resonance can be used to accurately determine IC50 values of individual ligand-receptor pairings. The molecular resolution achievable wih this approach can help distinguish inhibitors that specifically target individual complexes, or that can inhibit multiple functional interactions at the same time.

Keywords: BMP-4; Bone morphogenetic protein; Cerberus; IC(50); Inhibitor; SPR; Surface plasmon resonance; TGF-β.


Conflict of interest statement

CONFLICT OF INTERESTS

The authors declare no competing interests.

Figures

Figure 1
Figure 1. BMP-4 binding to Cerberus and receptors
(A) BMP-4 – Cer-Fc interaction. Cer-Fc was captured on the sensor chip and different concentrations of BMP-4 as shown were injected. (B) BMP-4 – ALK3-Fc interaction. ALK3-Fc was captured on the sensor chip and different concentrations of BMP-4 as shown were injected. (C) BMP-4 –ActRIIA-Fc interaction. ActRIIA-Fc was captured on the sensor chip and different concentrations of BMP-4 as shown were injected. (D) BMP-4 –BMPRII-Fc interaction. BMPRII-Fc was captured on the sensor chip and different concentrations of BMP-4 as shown were injected. (A–D) Colors of injection curves are matches with corresponding concentrations. Fitted curves (black lines) are superimposed over all experimental curves. Calculated binding rate constants and equilibrium dissociation rate constants are shown in Table 1.
Figure 2
Figure 2. Experimental design
(A) In a typical SPR binding experiment (left panel), the ‘analyte’ (BMP-4, shown as a blue triangle) is injected at increasing concentrations over the captured ‘ligand’ (ActRIIA-Fc, BMPRII-Fc, ALK3-Fc, Cerberus-Fc, etc., shown as a Y shape). When analyte binds to ligand, the SPR response increases with increasing analyte concentration until the surface is saturated by the analyte (see Figure 1). The binding-curve conforms to a Langmuir adsorption isotherm (right panel). (B) In the equilibrium displacement or competitive inhibitor format (left panel), the analyte concentration is fixed at a level that results in ~ 80% saturation. The injected sample is preincubated with increasing concentrations of ‘inhibitor’ (Fc free Cerberus, shown as brown shape). The analyte mediated SPR response decreases with increasing inhibitor concentration. The resulting inhibition curve follows an inversion of the Langmuir adsorption isotherm (right panel). (C) If the putative inhibitor forms a complex with the analyte that can bind the captured ligand (left panel), the starting SPR response corresponds to the free analyte response. The SPR response increases with increasing concentration of the co-binder (shown as green square) until all analyte is captured in a complex. This binding-curve also conforms to a Langmuir adsorption isotherm (right panel).
Figure 3
Figure 3. Inhibition of BMP-4 – receptor binding with Cerberus
(A) ActRIIA-Fc was captured on the sensor chip. (B) BMPRII-Fc was captured on the sensor chip. (C) ALK3-Fc was captured on the sensor chip. (A–C) In the three experiments, 60 nM BMP-4 was preincubated with 0 nM (blue), 9.375 nM (red), 18.75 nM (magenta), 37.5 nM (green), 75.0 nM (maroon), 150.0 nM (dark blue), 300.0 nM (purple), 600.0 nM (bright green), 1200.0 nM (teal), 2400.0 nM (cyan), and 4800.0 nM (grey) Fc free Cerberus. Cerberus – BMP-4 mixtures were injected over the sensor chip. (D) Analysis of SPR RU ActRIIA-Fc data (2A). Background subtracted raw RU values were taken for each Cerberus concentration at 150 seconds (blue), 300 seconds (purple) and 750 seconds (cyan) following injection of BMP-4 mixtures. RU values for each concentration group were normalized and fitted using the non-linear regression algorithm implemented in GraphPad. Standard errors (SEs) are shown. (E) Analysis of SPR RU data for ActRIIA-Fc (blue, from 2A), BMPRII-Fc (red, from 2B) and ALK3-Fc (green, from 2C). Background subtracted RU values were taken for each Cerberus concentration at 750 seconds of the SPR reaction. RU values for each group were normalized and fitted using non-linear regression in GraphPad. SEs are similar to those observed for ActRIIA-Fc inhibition in D, but are omitted here for clarity. (F) Analysis of ka data for ActRIIA-Fc (blue, from 2A), BMPRII-Fc (red, from 2B) and ALK3-Fc (green, from 2C). ka values were obtained by individually fitting each injection curve. ka values were normalized and fitted using non-linear regression in GraphPad. SEs are shown. (G) Same data as F, but Standard errors are omitted for clarity. (H) Analysis of kobs data for ActRIIA-Fc (blue, from 2A), BMPRII-Fc (red, from 2B) and ALK3-Fc (green, from 2C). kobs values were obtained by individually fitting each injection curve. kobs values were normalized and fitted using non-linear regression in GraphPad. SEs are similar to those observed for ka analysis in F, but are omitted here for clarity. (I) Cerberus prevents Activin B binding to type II receptors. SPR Background subtracted RU values were taken for each Cerberus concentration at 750 seconds of the SPR reaction for ActRIIA-Fc (blue) and BMPRII-Fc (red). RU values for each group were normalized and fitted using non-linear regression in GraphPad. Concentrations in panels D–I are shown in logarithmic scale.
Figure 4
Figure 4. Inhibition of BMP-4 – Cerberus binding with Cerberus
(A) Cerberus prevents BMP-4 – Cerberus-Fc binding. Cer-Fc was captured on the sensor chip and 60 nM BMP-4 preincubated with 0 nM (blue), 4.6875 nM (red), 9.375 nM (magenta), 18.75 nM (green), 37.5 nM (maroon), 75.0 nM (dark blue), 150.0 nM (purple), 300.0 nM (bright green), 600.0 nM (teal), 1200.0 nM (cyan), and 2400.0 nM (grey), Fc free Cerberus was injected over the sensor chip. (B) Background subtracted raw RU values were taken for each Cerberus concentration at 150 seconds (blue), 300 seconds (purple) and 750 seconds (cyan). RU values for each group were normalized and fitted using non-linear regression in GraphPad. SEs are similar to those observed for ActRIIA-Fc inhibition in 2D, but are omitted here for clarity. (C) Analysis of kobs (blue) and ka (red) data for Cerberus-Fc. kobs and ka values were obtained by individually fitting each injection curve. kobs and ka values were normalized and fitted using non-linear regression in GraphPad. SEs are similar to those observed for ka analysis in 2F, but are omitted here for clarity. (D) BMP-4 mediated Smad1/5/8 signaling and inhibition with Cerberus. HepG2 cells were transfected with SMAD1/5/8 responsive reporter and control plasmids. Cells were treated with 1.0 nM BMP-4, and Cer-Fc at the following concentrations: 0.0 nM, 0.03 nM, 0.09 nM, 0.27 nM, 0.82 nM, 2.47 nM, 7.41 nM, 22.2 nM, 66.6 nM, 200 nM, and 600 nM. Concentrations in panels B–D are shown in logarithmic scale.

Similar articles

Cited by

References

    1. LeRoith D, Bondy C. Growth factors and cytokines in health and disease : a multi-volume treatise. JAI Press; Greenwich, Conn: 1996.
    1. Feldmann M. Many cytokines are very useful therapeutic targets in disease. J Clin Invest. 2008;118:3533–3536. - PMC - PubMed
    1. Vilcek J, Feldmann M. Historical review: Cytokines as therapeutics and targets of therapeutics. Trends in pharmacological sciences. 2004;25:201–209. - PubMed
    1. Oppenheim JJ. Cytokines: past, present, and future. International journal of hematology. 2001;74:3–8. - PubMed
    1. Elvin JG, Couston RG, van der Walle CF. Therapeutic antibodies: market considerations, disease targets and bioprocessing. International journal of pharmaceutics. 2013;440:83–98. - PubMed

Publication types

MeSH terms

Substances