. 2016 Jul 8;353(6295):179-84.
doi: 10.1126/science.aaf6756. Epub 2016 Jun 30.

Reengineering chimeric antigen receptor T cells for targeted therapy of autoimmune disease

Affiliations

Reengineering chimeric antigen receptor T cells for targeted therapy of autoimmune disease

Christoph T Ellebrecht et al. Science. .

Abstract

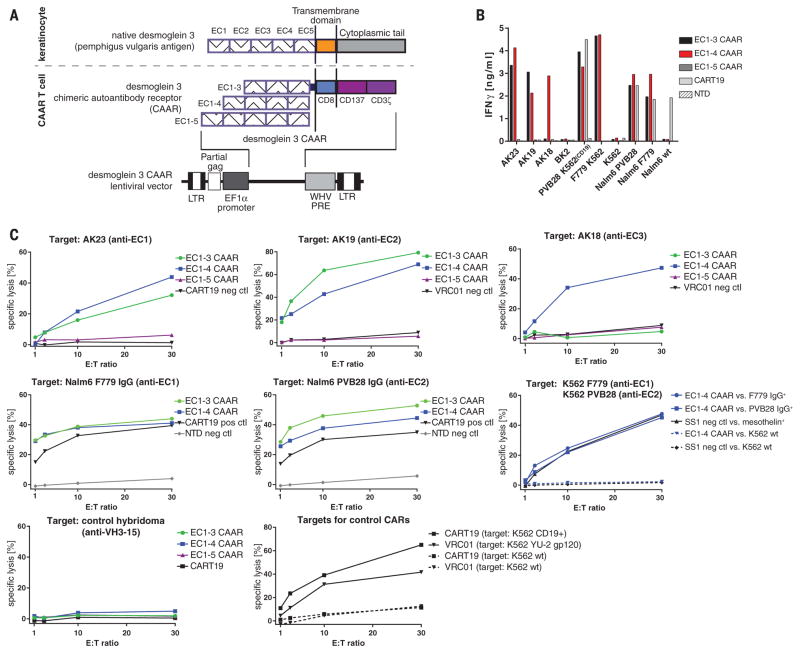
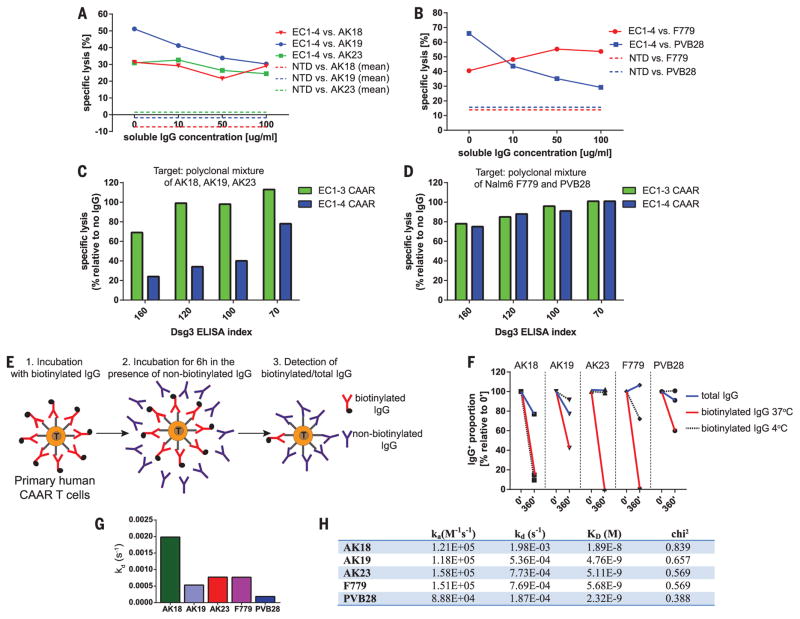
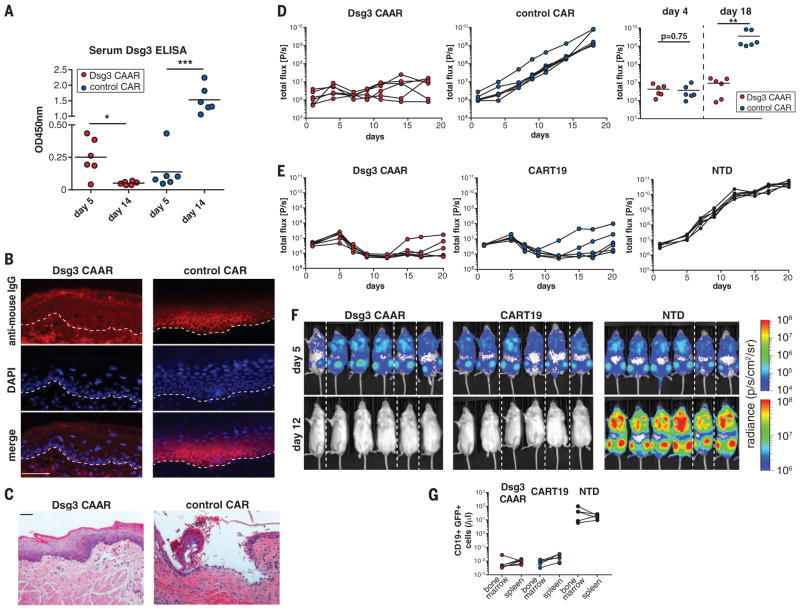
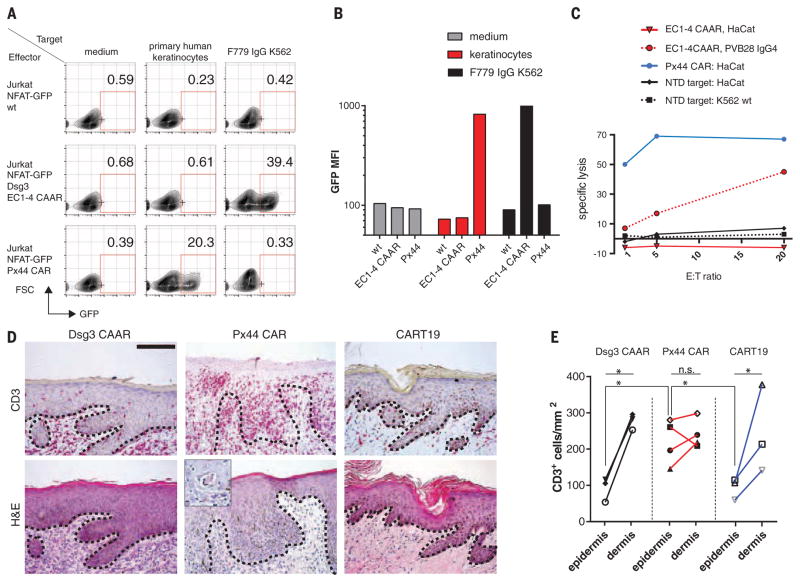
Ideally, therapy for autoimmune diseases should eliminate pathogenic autoimmune cells while sparing protective immunity, but feasible strategies for such an approach have been elusive. Here, we show that in the antibody-mediated autoimmune disease pemphigus vulgaris (PV), autoantigen-based chimeric immunoreceptors can direct T cells to kill autoreactive B lymphocytes through the specificity of the B cell receptor (BCR). We engineered human T cells to express a chimeric autoantibody receptor (CAAR), consisting of the PV autoantigen, desmoglein (Dsg) 3, fused to CD137-CD3ζ signaling domains. Dsg3 CAAR-T cells exhibit specific cytotoxicity against cells expressing anti-Dsg3 BCRs in vitro and expand, persist, and specifically eliminate Dsg3-specific B cells in vivo. CAAR-T cells may provide an effective and universal strategy for specific targeting of autoreactive B cells in antibody-mediated autoimmune disease.


Figures

Fig. 1
Fig. 1. Dsg3 CAAR-T cells demonstrate specific and potent cytotoxicity
(A) Schematic of native Dsg3, Dsg3 CAAR, and lentiviral vector for stable CAAR expression. (B) Specific IFN-γ production by CAAR-Ts as measured by ELISA from coculture supernatant after 24 hours. Cultures were set up in duplicate; mean values are shown. Similar results were obtained in independent experiments from at least five different healthy Tcell donors. (C) 51Cr release after 4 hours of Tcell–target cell coculture at indicated effector to target (E:T) ratios to measure specific cytotoxicity by Dsg3 CAAR-Ts against distinct anti-Dsg3 target cells. Mean values of triplicate cultures are shown. Similar results were obtained in independent experiments from at least five different healthy Tcell donors.
Fig. 2
Fig. 2. Dsg3 CAAR-Tcells maintain cytotoxicity in the presence of soluble antibodies to Dsg3
(A to D) 51Cr release after 4 hours of T cell–target cell coculture at an E:T ratio of 30:1 to measure specific cytotoxicity by Dsg3 CAAR-Ts in the presence of [(A) and (B)] soluble, monoclonal antibodies to Dsg3 at indicated concentrations or [(C) and (D)] soluble, polyclonal antibodies to Dsg3 at indicated Dsg3 ELISA indices. Mean values from triplicate cultures are shown. Results are representative of two independent experiments with CAAR-T cells from two different donors. (E) Experimental setup for pulse-chase antibody cell-surface binding assay. (F) Total surface IgG and retained biotinylated IgG were detected by flow cytometry after 6 hours of culture with excess nonbiotinylated IgG at 4°C and 37°C to assess the blocking property of soluble IgG toward each B cell clone. Similar results were replicated in three independent experiments with Dsg3EC1-4 CAAR-T cells from three different T cell donors. (G and H) Surface plasmon resonance demonstrating higher off-rates (kd) and lower affinity (higher KD) of nonblocking antibodies AK18, AK23, and F779. Values were calculated from four different concentrations, as indicated in fig. S6A.
Fig. 3
Fig. 3. Dsg3 CAAR-T cells eliminate anti-Dsg3 target cells in vivo
(A) Serum anti-Dsg3 ELISA was performed on days 5 and 14 to quantify IgG production by hybridoma cells before and after CAAR-T treatment. Paired t test, two-tailed; *P < 0.05; ***P < 0.001. (B) Direct immunofluorescence of mucosa samples to detect IgG deposition after CAAR-T or control Tcell treatment. Absence of IgG deposition was seen in all CAAR-T–treated mice. (C) Histologic mucosal blister formation (i.e., acantholysis) was assessed after CAAR-T treatment. None of six CAAR-T–treated mice, versus five of six control Tcell–treated mice, demonstrated acantholysis; P = 0.015, Fisher’s exact test. Scale bars in (B) and (C), 50 μm. (D) Serial quantification of hybridoma burden by bioluminescence imaging. Unpaired Mann-Whitney test, two-tailed, **P < 0.01; results were replicated in an independent experiment with Tcells from a different donor. Symbols represent one mouse each; horizontal black lines represent the mean of each group. (E) Bioluminescence imaging quantification of Nalm6 CD19+ B cells expressing PVB28/F779 IgG after Dsg3 CAAR-T, anti-CD19 CAR-T (CART19), or nontransduced Tcell (NTD) treatment. (F) Bioluminescence on days 5 and 12 after Nalm6 injection. Dashed lines separate images from different cages. (G) Flow cytometric quantification of Nalm6 cells in bone marrow and spleen in the three treatment groups 22 days after Nalm6 injection.
Fig. 4
Fig. 4. Dsg3 CAAR-Tcells do not showoff-target toxicity
(A) Flow-cytometric quantification of CAAR-mediated signal transduction, as indicated by nuclear factor of activated Tcells (NFAT)–driven green fluorescent protein (GFP) expression in Jurkat reporter cells, using anti-Dsg3/1 Px44 CAR as a positive control for keratinocyte expression of Dsg3. Numbers indicate percentage of live, single cells in the GFP-positive gate. (B) Mean fluorescence intensity of GFP expression from (A). Representative data were replicated in at least five independent experiments with keratinocytes from different human donors. (C) 51Cr release after T cell–target cell coculture at indicated E:T ratios to measure cytotoxicity by Dsg3 CAAR-Ts and controls against human HaCat keratinocytes. Mean values of triplicate cultures are shown; similar results were obtained in two independent experiments. (D) Microscopic analysis of human skin xenografts to evaluate epidermal infiltration by Dsg3CAAR-Ts, positive control Px44 CAR-Ts, and negative control CART19. (Inset) Dyskeratotic keratinocytes surrounded by T cells. Dashed line shows dermal-epidermal junction. Scale bar, 125 μm. (E) Quantification of T cell infiltration into epidermis and dermis of human skin xenografts. Each symbol represents one mouse; ratio-paired t test, two-tailed, *P < 0.05; n.s. nonsignificant; data are pooled from two independent experiments.

Comment in

Similar articles

Cited by

References

    1. Payne AS, Stanley JR. In: Dermatology in General Medicine. Wolff K, et al., editors. chap. 53 McGraw Hill; New York: 2012.
    1. Colliou N, et al. Sci Transl Med. 2013;5:175ra30. - PubMed
    1. Eming R, et al. J Invest Dermatol. 2008;128:2850–2858. - PubMed
    1. Lunardon L, et al. Arch Dermatol. 2012;148:1031–1036. - PMC - PubMed
    1. Hammers CM, et al. J Invest Dermatol. 2015;135:742–749. - PMC - PubMed

Publication types

MeSH terms