. 2016 May 31:8:ecurrents.outbreaks.f14b2217c902f453d9320a43a35b9583.
doi: 10.1371/currents.outbreaks.f14b2217c902f453d9320a43a35b9583.

Using Phenomenological Models to Characterize Transmissibility and Forecast Patterns and Final Burden of Zika Epidemics

Affiliations

Using Phenomenological Models to Characterize Transmissibility and Forecast Patterns and Final Burden of Zika Epidemics

Gerardo Chowell et al. PLoS Curr. .

Abstract

Background: The World Health Organization declared the ongoing Zika virus (ZIKV) epidemic in the Americas a Public Health Emergency of International Concern on February 1, 2016. ZIKV disease in humans is characterized by a "dengue-like" syndrome including febrile illness and rash. However, ZIKV infection in early pregnancy has been associated with severe birth defects, including microcephaly and other developmental issues. Mechanistic models of disease transmission can be used to forecast trajectories and likely disease burden but are currently hampered by substantial uncertainty on the epidemiology of the disease (e.g., the role of asymptomatic transmission, generation interval, incubation period, and key drivers). When insight is limited, phenomenological models provide a starting point for estimation of key transmission parameters, such as the reproduction number, and forecasts of epidemic impact.

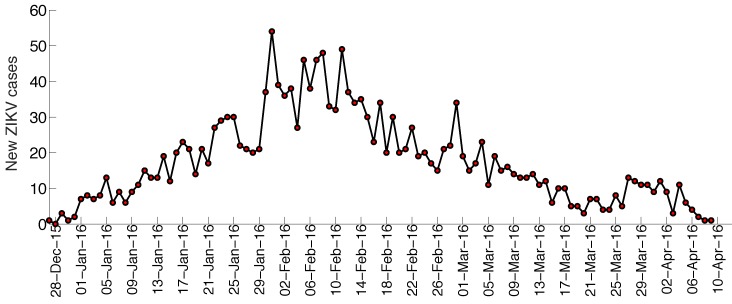
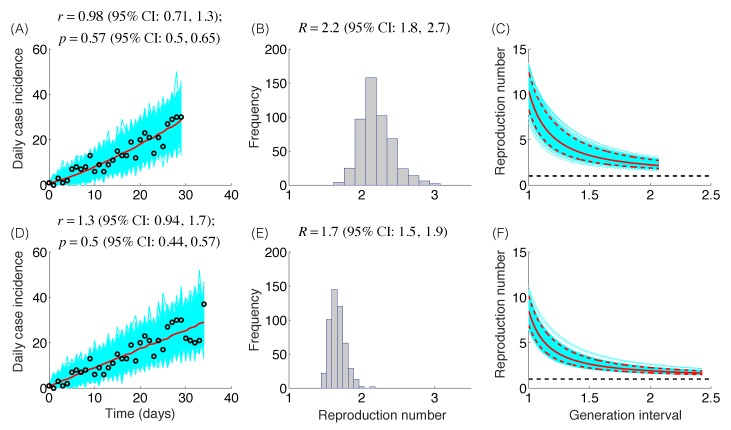
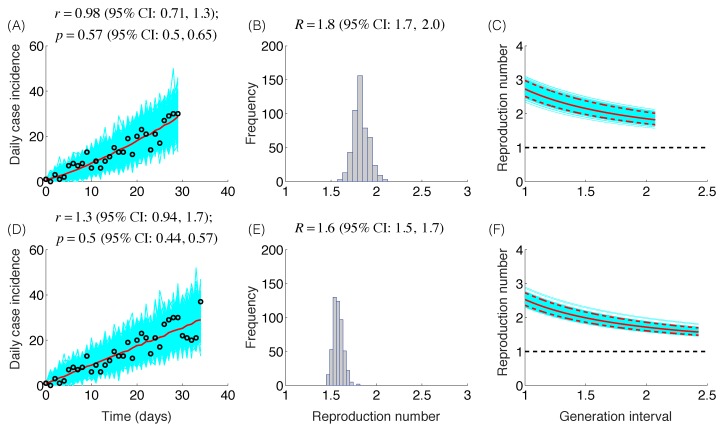
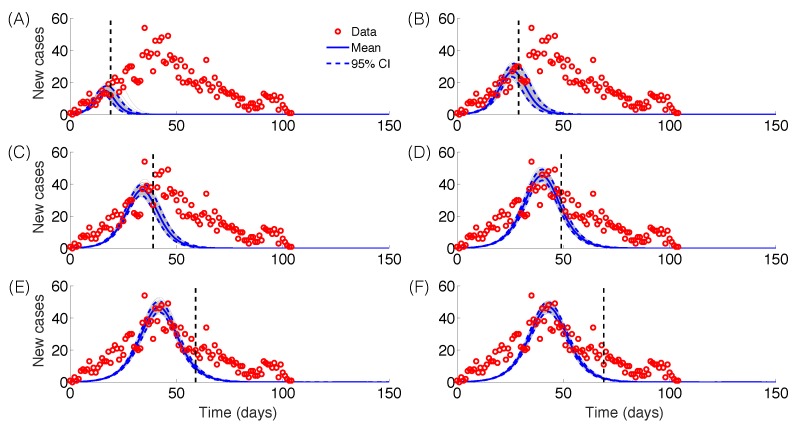
Methods: We obtained daily counts of suspected Zika cases by date of symptoms onset from the Secretary of Health of Antioquia, Colombia during January-April 2016. We calibrated the generalized Richards model, a phenomenological model that accommodates a variety of early exponential and sub-exponential growth kinetics, against the early epidemic trajectory and generated predictions of epidemic size. The reproduction number was estimated by applying the renewal equation to incident cases simulated from the fitted generalized-growth model and assuming gamma or exponentially-distributed generation intervals derived from the literature. We estimated the reproduction number for an increasing duration of the epidemic growth phase.

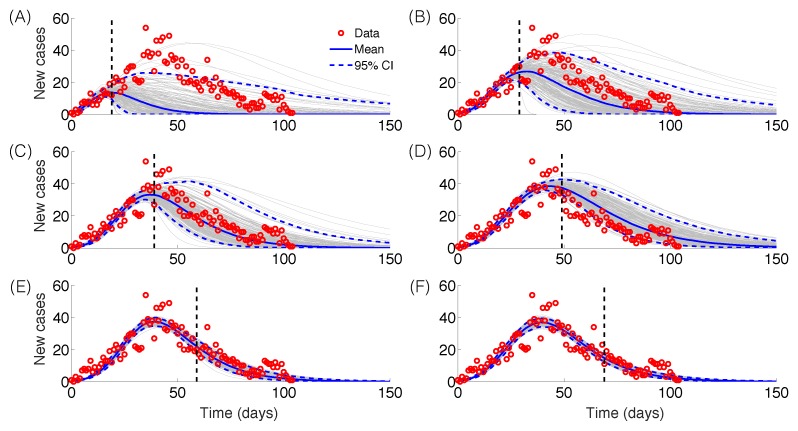
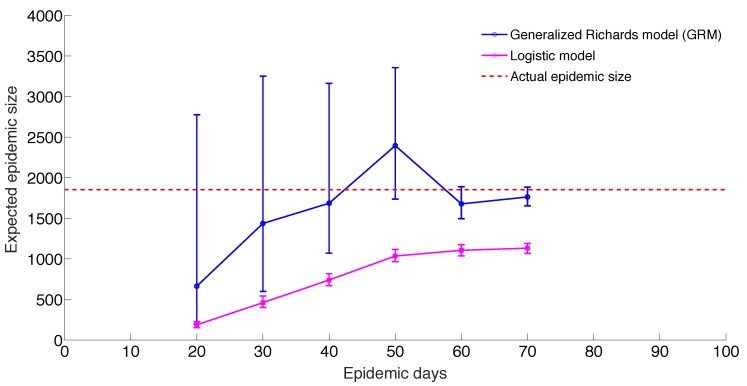
Results: The reproduction number rapidly declined from 10.3 (95% CI: 8.3, 12.4) in the first disease generation to 2.2 (95% CI: 1.9, 2.8) in the second disease generation, assuming a gamma-distributed generation interval with the mean of 14 days and standard deviation of 2 days. The generalized-Richards model outperformed the logistic growth model and provided forecasts within 22% of the actual epidemic size based on an assessment 30 days into the epidemic, with the epidemic peaking on day 36.

Conclusion: Phenomenological models represent promising tools to generate early forecasts of epidemic impact particularly in the context of substantial uncertainty in epidemiological parameters. Our findings underscore the need to treat the reproduction number as a dynamic quantity even during the early growth phase, and emphasize the sensitivity of reproduction number estimates to assumptions on the generation interval distribution.


Figures

Zika case series, Antioquia, Colombia
The time series for the number of new cases according to the date of symptoms onset of the Zika epidemic in Antioquia, Colombia.
Reproduction number, gamma-distributed generation interval
The model fits (A,D), empirical distributions of the reproduction number (B,E), and the estimated profiles of the reproduction number as a function of disease generations (C,F) using an increasing length of the early growth phase comprising 30 (A-C) and 35 (D-F) epidemic days. Model fit (red curve) and the associated uncertainty from individual bootstrapped curves assuming a Poisson error structure (cyan curves) to the case incidence data (black circles) are shown. Using 30 and 35 epidemic days of the Zika epidemic in Antioquia, the reproduction number was estimated at 2.2 (95%CI: 1.8, 2.7) and 1.7 (95% CI: 1.5, 1.9), respectively, given a gamma-distributed generation interval with the mean of 14 days (SD=2 days).
Reproduction number, exponentially-distributed generation interval
The model fits (A,D), empirical distributions of the reproduction number (B,E), and the estimated profiles of the reproduction number as a function of disease generations (C,F) using an increasing length of the early growth phase comprising 30 (A-C) and 35 (D-F) epidemic days. Model fit (red curve) and the associated uncertainty from individual bootstrapped curves assuming a Poisson error structure (cyan curves) to the case incidence data (black circles) are shown. Using 30 and 35 epidemic days of the Zika epidemic in Antioquia, the reproduction number was estimated at 1.8 (95%CI: 1.7, 2.0) and 1.6 (95% CI: 1.5, 1.7), respectively, given an exponentially-distributed generation interval with the mean of 14 days.
Epidemic forecasts, GRM model
Epidemic forecasts based on the Generalized Richards Model (GRM) calibrated using an increasing amount of epidemic data (red circles): (A) 20, (B) 30, (C) 40, (D) 50, (E) 60 and (F) 70 epidemic days. The vertical dashed line indicates the end of the calibration period. The mean (solid blue line) and 95% CIs (dashed blue lines) of the model fit ensembles (gray curves) are shown.
Epidemic forecasts, logistic growth model
Epidemic forecasts based on the logistic growth model calibrated using an increasing amount of epidemic data (red circles): (A) 20, (B) 30, (C) 40, (D) 50, (E) 60 and (F) 70 epidemic days. The vertical dashed line indicates the end of the calibration period. The mean (solid blue line) and 95% CIs (dashed blue lines) of the model fit ensembles (gray curves) are shown.
Predicting epidemic size, GRM model and logistic growth models
Mean and 95% CI of the forecasts for the expected epidemic final size of ZIKV cases in Antioquia, Colombia using the generalized Richards model (GRM) and the logistic growth model with increasing time-length of incidence data from 20 to 70 days.

References

    1. Roze B, Najioullah F, Ferge JL, Apetse K, Brouste Y, et al. (2016) Zika virus detection in urine from patients with Guillain-Barre syndrome on Martinique, January 2016. Euro Surveill 21. - PubMed
    1. Zika Virus. Centers for Disease Control and Prevention. Available from: http://www.cdc.gov/zika/ (accessed on April 20, 2016).
    1. Foy BD, Kobylinski KC, Chilson Foy JL, Blitvich BJ, Travassos da Rosa A, et al. (2011) Probable non-vector-borne transmission of Zika virus, Colorado, USA. Emerg Infect Dis 17: 880-882. - PMC - PubMed
    1. Gourinat AC, O'Connor O, Calvez E, Goarant C, Dupont-Rouzeyrol M (2015) Detection of Zika virus in urine. Emerg Infect Dis 21: 84-86. - PMC - PubMed
    1. Mlakar J, Korva M, Tul N, Popovic M, Poljsak-Prijatelj M, et al. (2016) Zika Virus Associated with Microcephaly. N Engl J Med 374: 951-958. - PubMed

LinkOut - more resources