. 2016 Jul 19;7(29):46579-46588.
doi: 10.18632/oncotarget.10300.

Basal autophagy is pivotal for Hodgkin and Reed-Sternberg cells' survival and growth revealing a new strategy for Hodgkin lymphoma treatment

Affiliations

Basal autophagy is pivotal for Hodgkin and Reed-Sternberg cells' survival and growth revealing a new strategy for Hodgkin lymphoma treatment

Katrin Birkenmeier et al. Oncotarget. .

Abstract

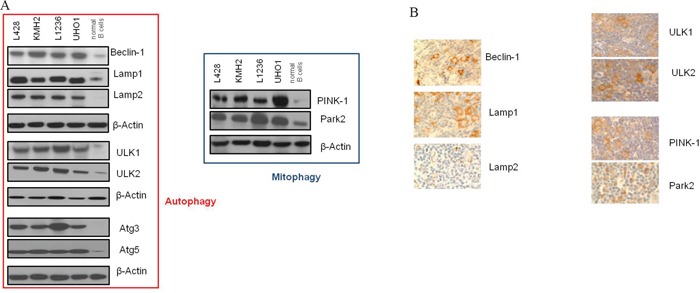
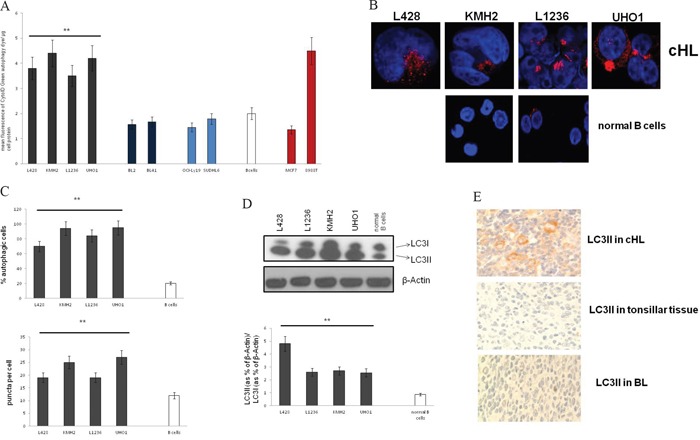
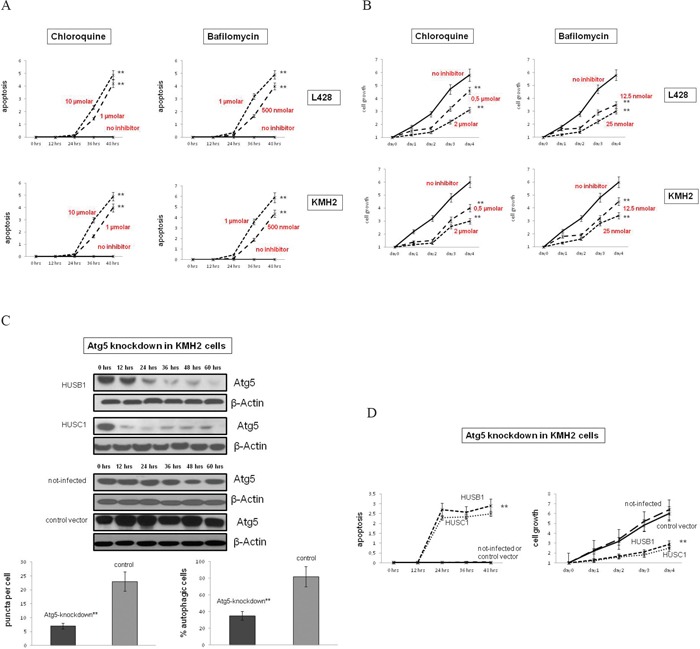
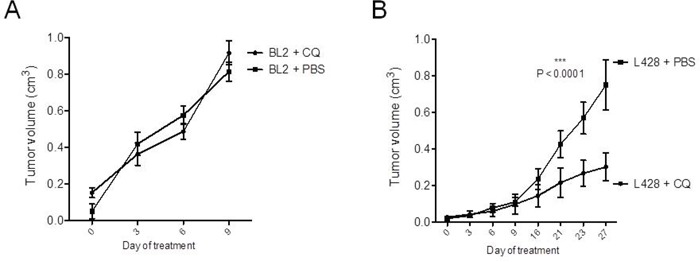
As current classical Hodgkin lymphoma (cHL) treatment strategies have pronounced side-effects, specific inhibition of signaling pathways may offer novel strategies in cHL therapy. Basal autophagy, a regulated catabolic pathway to degrade cell's own components, is in cancer linked with both, tumor suppression or promotion. The finding that basal autophagy enhances tumor cell survival would thus lead to immediately testable strategies for novel therapies. Thus, we studied its contribution in cHL.We found constitutive activation of autophagy in cHL cell lines and primary tissue. The expression of key autophagy-relevant proteins (e.g. Beclin-1, ULK1) and LC3 processing was increased in cHL cells, even in lymphoma cases. Consistently, cHL cells exhibited elevated numbers of autophagic vacuoles and intact autophagic flux. Autophagy inhibition with chloroquine or inactivation of ATG5 induced apoptosis and reduced proliferation of cHL cells. Chloroquine-mediated inhibition of basal autophagy significantly impaired HL growth in-vivo in NOD SCID γc-/- (NSG) mice. We found that basal autophagy plays a pivotal role in sustaining mitochondrial function.We conclude that cHL cells require basal autophagy for growth, survival and sustained metabolism making them sensitive to autophagy inhibition. This suggests basal autophagy as useful target for new strategies in cHL treatment.

Keywords: B-cell lymphoma; Hodgkin lymphoma; autophagy; lymphoma pathogenesis; targeted therapy.


Conflict of interest statement

The authors declare no competing financial interests.

Figures

Figure 1
Figure 1. Autophagy-relevant genes are up-regulated in cHL
A. Expression analysis by Western Blot was performed of a total of 9 autophagy-relevant proteins in cHL cell lines compared to normal non-malignant GC B cells. Shown is one representative Blot for each protein tested of a total of n=5 experiments. β-Actin was used as a loading control. B. Immunohistochemical stainings of paraffin sections of lymph nodes from patients with cHL for autophagy-relevant proteins (400x magnification).
Figure 2
Figure 2. LC3 processing and the number of autophagosomes are increased in cHL
A. Analysis of the mean fluorescence by FACS after staining of autophagosomes was performed in cHL, BL, and DLBCL cell lines, GC B cells, MCF7 cells and 8988T cells. Results are expressed as means±SD for n=6 experiments. ** cHL cell lines significantly different vs. GC B cells by the t-test (p<0.001). B. Fluorescence micrographs are shown of LC3II puncta in cHL cell lines and GC B cells. C. % of autophagic cells (upper panel), and LC3 puncta per cell (lower panel) were determined by confocal fluorescence microscopy of fixed cells stained with an antibody to LC3II. For quantification of autophagic cells pictures were taken under constant settings of 5-10 cells per micrograph. % of LC3II-positive cells was investigated of totally 50 cells per cell type. Fluorescent puncta were counted per cell of totally 50 cells per cell type and the mean value of puncta was calculated. Data are presented as means±SD. ** Cell lines significantly different vs. control group by the t-test (p<0.001). D. LC3 expression was analyzed by Western Blot in cHL cell lines and normal B cells (upper panel) and analyzed as the ratio of LC3II to LC3I (lower panel). Shown is one representative Western Blot of a total of n=5 experiments. Cells were grown under normal cell culture conditions, and lysates were prepared from cells that were no longer left in culture than 48 hrs without passaging to prevent autophagy-inducing nutrient deprivation. Densitometric analysis was performed using ImageJ. Results are expressed as means±SED; ** cHL cell lines significantly different from control group by the t-test (p<0.01). E. Immunohistochemical staining of cHL cases and normal non-malignant lymphoid tissue (control tissue) to LC3II.
Figure 3
Figure 3. Autophagy inhibition reduces cell growth and induces apoptosis in cHL cells
A. The cHL cell lines L428 and KMH2 were pre-incubated with the autophagy inhibitors CQ or Baf in two different concentrations of each. Apoptosis was determined by quantification of cytosolic nucleosomes over 48 hrs of incubation (ELISA). Difference in mean absorbance at A405 and A450 was measured. Results are expressed as means±SD for n=3 experiments for each cell line and each condition tested. ** Cell lines significantly different vs. control group (treated vs. untreated cells) by the t-test (p<0.001). B. Cell growth of cHL cell lines treated with CQ or Baf, as compared to untreated cells was determined by trypan blue exclusion method. Results are expressed as means±SD for n=3 experiments for each cell line and each condition tested. ** Cell lines significantly different vs. control group (treated vs. untreated cells) by the t-test (p<0.001). C. To inactivate autophagy genetically KMH2 cells were infected with two different lentiviral vectors encoding two different shRNAs (HUSB1, HUSC1) that inhibit ATG5-RNA expression. Upper panel, ATG5 expression in these cells and in control cells (infected with empty vectors or not infected) was determined by Western Blot analysis. β-Actin was used as a loading control. Shown is one representative Blot of n=3 experiments. Lower panel, To analyze the status-quo of autophagy knockdown cells and control cells were stained to LC3II and % autophagic cells was determined by confocal microscopy analysis. Results are expressed as means±SD for n=4 experiments. ** Cell lines significantly different vs. control group (knockdown vs. control cells (infected with empty vector or not-infected)) by the t-test (p<0.001). D. Apoptosis/cell growth of ATG5-knockdown and control KMH2 cells was analyzed by trypan blue exclusion method. ** Cell lines significantly different vs. control group (knockdown vs. control cells (infected with empty vector or not-infected)) by the t-test (p<0.01).
Figure 4
Figure 4. CQ-treatment significantly inhibits cHL growth in-vivo
1×10⁵ cells of BL cell line BL2 A. and 1×10⁶ cells of cHL cell line L428 B. were transplanted subcutaneously into the flanks of highly immunodeficient NSG mice (10 animals per cell line). After successful growth of xenograft tumors, recipient animals were divided into two cohorts for each cell line. Animals were either treated by daily intraperitoneal injections of 60 mg/kg CQ in PBS or with PBS only, as a control. Statistical analysis was performed by two-way ANOVA test. The statistical significance for the comparison of PBS and CQ-treated animals of the L428 group is indicated by the P-value shown in the graph.

Similar articles

Cited by

References

    1. Hellman S. Brief Consideration of Thomas Hodgkin and His Times. In: Hoppe RT, Mauch PT, Armitage JO, Diehl V, Weiss LM, editors. Hodgkin Lymphoma. 2. Philadelphia: Wolters Kluwer Health/Lippincott Williams & Wilkins; 2007.
    1. Hodgkin T. On some morbid experiences of the absorbent glands and spleen. Med Chir Trans. 1832;17:69–97. - PMC - PubMed
    1. Küppers R. The biology of Hodgkin's lymphoma. Nat Rev Cancer. 2009;9:15–27. - PubMed
    1. Greaves W, Xiao L, Sanchez-Espiridion B, Kunkalla K, Dave KS, Liang CS, Singh RR, Younes A, Medeiros LJ, Vega F. Detection of ABCC1 expression in classical Hodgkin lymphoma is associated with increased risk of treatment failure using standard chemotherapy protocols. Hematol Oncol. 2012;5:47. - PMC - PubMed
    1. Lowry L, Hoskin P, Linch D. Developments in the management of Hodgkin's lymphoma. Lancet. 2010;375:786–788. - PubMed