Responses in early visual areas to contour integration are context dependent
- PMID: 27366994
- PMCID: PMC4946811
- DOI: 10.1167/16.8.19
Responses in early visual areas to contour integration are context dependent
Abstract
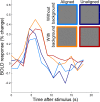
It has been shown that early visual areas are involved in contour processing. However, it is not clear how local and global context interact to influence responses in those areas, nor has the interarea coordination that yields coherent structural percepts been fully studied, especially in human observers. In this study, we used functional magnetic resonance imaging (fMRI) to measure activity in early visual cortex while observers performed a contour detection task in which alignment of Gabor elements and background clutter were manipulated. Six regions of interest (two regions, containing either the cortex representing the target or the background clutter, in each of areas V1, V2, and V3) were predefined using separate target versus background functional localizer scans. The first analysis using a general linear model showed that in the presence of background clutter, responses in V1 and V2 target regions of interest were significantly stronger to aligned than unaligned contours, whereas when background clutter was absent, no significant difference was observed. The second analysis using interarea correlations showed that with background clutter, there was an increase in V1-V2 coordination within the target regions when perceiving aligned versus unaligned contours; without clutter, however, correlations between V1 and V2 were similar no matter whether aligned contours were present or not. Both the average response magnitude and the connectivity analysis suggest different mechanisms support contour processing with or without background distractors. Coordination between V1 and V2 may play a major role in coherent structure perception, especially with complex scene organization.
Figures


Similar articles
-
Orientation-cue invariant population responses to contrast-modulated and phase-reversed contour stimuli in macaque V1 and V2.PLoS One. 2014 Sep 4;9(9):e106753. doi: 10.1371/journal.pone.0106753. eCollection 2014. PLoS One. 2014. PMID: 25188576 Free PMC article.
-
Recurrent Processing of Contour Integration in the Human Visual Cortex as Revealed By fMRI-Guided TMS.Cereb Cortex. 2019 Jan 1;29(1):17-26. doi: 10.1093/cercor/bhx296. Cereb Cortex. 2019. PMID: 29161359
-
Disambiguating the roles of area V1 and the lateral occipital complex (LOC) in contour integration.Neuroimage. 2013 Apr 1;69:146-56. doi: 10.1016/j.neuroimage.2012.11.023. Epub 2012 Nov 28. Neuroimage. 2013. PMID: 23201366 Free PMC article.
-
Neuronal correlates of real and illusory contour perception: functional anatomy with PET.Eur J Neurosci. 1999 Nov;11(11):4024-36. doi: 10.1046/j.1460-9568.1999.00805.x. Eur J Neurosci. 1999. PMID: 10583491
-
Dissociable neural correlates of contour completion and contour representation in illusory contour perception.Hum Brain Mapp. 2012 Oct;33(10):2407-14. doi: 10.1002/hbm.21371. Epub 2011 Aug 8. Hum Brain Mapp. 2012. PMID: 21826763 Free PMC article.
Cited by
-
Topographic signatures of global object perception in human visual cortex.Neuroimage. 2020 Oct 15;220:116926. doi: 10.1016/j.neuroimage.2020.116926. Epub 2020 May 19. Neuroimage. 2020. PMID: 32442640 Free PMC article.
-
What multiplexing means for the interpretation of functional MRI data.Front Hum Neurosci. 2023 Apr 6;17:1134811. doi: 10.3389/fnhum.2023.1134811. eCollection 2023. Front Hum Neurosci. 2023. PMID: 37091812 Free PMC article.
-
Distinct effects of contour smoothness and observer bias on visual persistence.J Vis. 2017 Feb 1;17(2):8. doi: 10.1167/17.2.8. J Vis. 2017. PMID: 28245488 Free PMC article.
-
Aberrant Cortical Connectivity During Ambiguous Object Recognition Is Associated With Schizophrenia.Biol Psychiatry Cogn Neurosci Neuroimaging. 2021 Dec;6(12):1193-1201. doi: 10.1016/j.bpsc.2020.09.018. Epub 2020 Oct 10. Biol Psychiatry Cogn Neurosci Neuroimaging. 2021. PMID: 33359154 Free PMC article.
-
Fragmented ambiguous objects: Stimuli with stable low-level features for object recognition tasks.PLoS One. 2019 Apr 11;14(4):e0215306. doi: 10.1371/journal.pone.0215306. eCollection 2019. PLoS One. 2019. PMID: 30973914 Free PMC article.
References
-
- Allman J.,, Miezin F.,, McGuinness E. (1985). Stimulus specific responses from beyond the classical receptive field: Neurophysiological mechanisms for local–global comparisons in visual neurons. Annual Review of Neuroscience, 8, 407–430, doi:http://dx.doi.org/10.1146/annurev.ne.08.030185.002203. - DOI - PubMed
-
- Altmann C. F.,, Bülthoff H. H.,, Kourtzi Z. (2003). Perceptual organization of local elements into global shapes in the human visual cortex. Current Biology, 13, 342–349, doi:http://dx.doi.org/10.1016/S0960-9822(03)00052-6. - DOI - PubMed
-
- Anderson J. C.,, Martin K. A. C. (2009). The synaptic connections between cortical areas V1 and V2 in macaque monkey. The Journal of Neuroscience, 29, 11283–11293, doi:http://dx.doi.org/10.1523/JNEUROSCI.5757-08.2009. - DOI - PMC - PubMed
-
- Attneave F. (1954). Some informational aspects of visual perception. Psychological Review, 61, 183–193. - PubMed
MeSH terms
Grants and funding
LinkOut - more resources
Full Text Sources
Other Literature Sources
Molecular Biology Databases

