. 2016 Jul 1;12(7):e1004995.
doi: 10.1371/journal.pcbi.1004995. eCollection 2016 Jul.

Cellular Interrogation: Exploiting Cell-to-Cell Variability to Discriminate Regulatory Mechanisms in Oscillatory Signalling

Affiliations

Cellular Interrogation: Exploiting Cell-to-Cell Variability to Discriminate Regulatory Mechanisms in Oscillatory Signalling

Javier Estrada et al. PLoS Comput Biol. .

Abstract

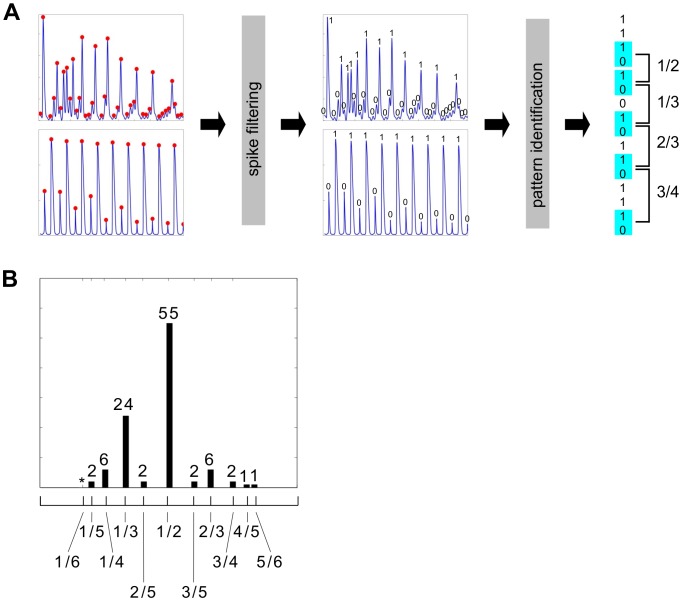
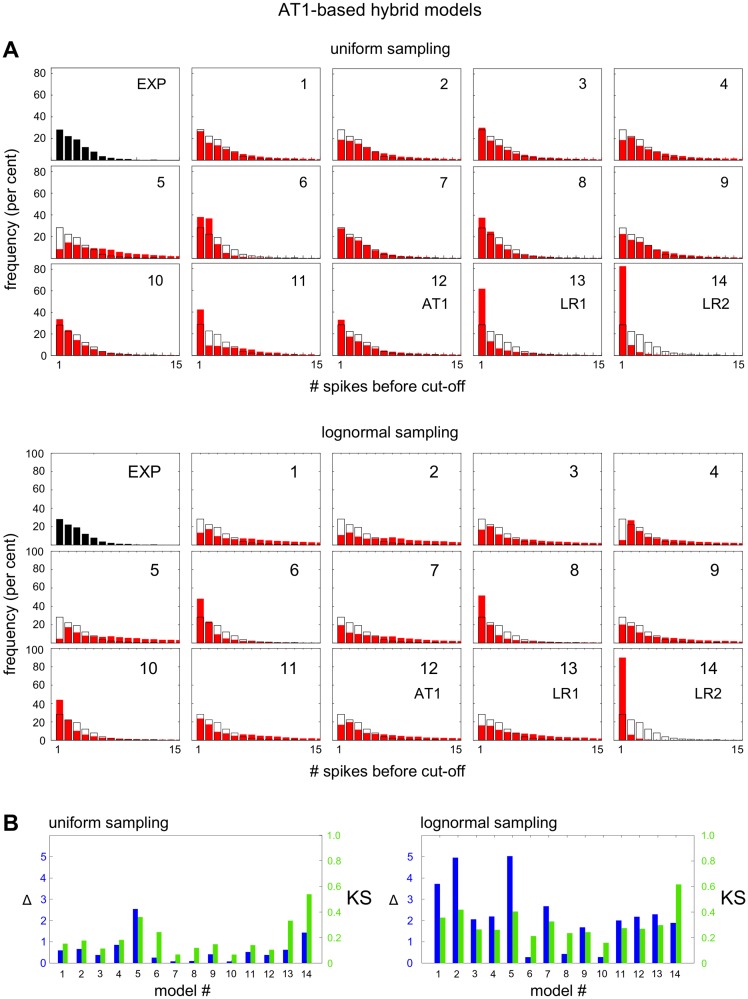
The molecular complexity within a cell may be seen as an evolutionary response to the external complexity of the cell's environment. This suggests that the external environment may be harnessed to interrogate the cell's internal molecular architecture. Cells, however, are not only nonlinear and non-stationary, but also exhibit heterogeneous responses within a clonal, isogenic population. In effect, each cell undertakes its own experiment. Here, we develop a method of cellular interrogation using programmable microfluidic devices which exploits the additional information present in cell-to-cell variation, without requiring model parameters to be fitted to data. We focussed on Ca2+ signalling in response to hormone stimulation, which exhibits oscillatory spiking in many cell types and chose eight models of Ca2+ signalling networks which exhibit similar behaviour in simulation. We developed a nonlinear frequency analysis for non-stationary responses, which could classify models into groups under parameter variation, but found that this question alone was unable to distinguish critical feedback loops. We further developed a nonlinear amplitude analysis and found that the combination of both questions ruled out six of the models as inconsistent with the experimentally-observed dynamics and heterogeneity. The two models that survived the double interrogation were mathematically different but schematically identical and yielded the same unexpected predictions that we confirmed experimentally. Further analysis showed that subtle mathematical details can markedly influence non-stationary responses under parameter variation, emphasising the difficulty of finding a "correct" model. By developing questions for the pathway being studied, and designing more versatile microfluidics, cellular interrogation holds promise as a systematic strategy that can complement direct intervention by genetics or pharmacology.


Conflict of interest statement

The authors have declared that no competing interests exist.

Figures

Fig 1
Fig 1. Cellular circuitry and experimental methodology.
(A) Components of the calcium signalling toolkit are shown, as relevant to the models discussed in this paper. Yellow circles represent the principal small-molecule species involved in calcium dynamics, IP3, Ca2+ in the cytoplasm (Ca CY) and Ca2+ in the ER (Ca ER). Black lines denote Ca2+ fluxes, dashed blue lines denote activation. The positive and negative feedbacks between the components are illustrated in Fig 3. Abbreviations used: GPCR, G-protein coupled receptor; IP3, inositol-1,4,5-trisphosphate; IP3 R, IP3 receptor; NCX, Na+-Ca2+ exchanger; PIP2, phosphatidylinositol-4,5-bisphosphate; PLC, phospholipase C; PMCA, plasma membrane Ca2+ -ATPase; SERCA, sarco/endo-plasmic reticulum Ca2+ -ATPase; mCU, mitochondrial Ca2+ uniporter; NCXm, mitochondrial Na+-Ca2+ exchanger. (B) Microfluidic platform. From left to right: first, a schematic of the two-layer PDMS device. Buffer and histamine plus buffer are provided through the indicated flow lines (blue) at 5 psig. Valves are regulated by computer through the control lines (red), operating at 25 psig, to supply histamine or buffer to the output port, thereby generating steps or pulses, as required. Second, a photograph of the device bonded to the glass-bottomed dish (Chip-In-A-Dish), showing the four tubes leading to the control lines. Third, a differential interference contrast image of HeLa cells growing in the dish next to the output port, with the device border outlined in red. Fourth, fluorescence microscopy image, showing typical Fluo4 fluorescence in response to histamine stimulation.
Fig 2
Fig 2. Cellular responses to steps and pulses.
(A) Plots of two cells (identified in the top right-hand corner by experiment number and cell number as listed in S1 Text), showing effective Ca2+ concentration in the cytoplasm as a function of time, in response to a step of 10 μM histamine, illustrated in the graph on the left and also beneath each plot in red. The inset shows a histogram of mean inter-spike periods over all cells for three step experiments (experiment numbers 1–3 in S1 Text), with the green bar showing a mean ± SD of 130 ± 40. (B) Plots of two cells, as previously, in response to repetitive pulses of 10 μM histamine with a pulse width of 22 seconds and an inter-pulse period of 60 seconds, as defined in the graph on the left.
Fig 3
Fig 3. Models of oscillatory Ca2+ spiking.
Eight schematic molecular networks are shown; citations to the original papers are given in S1 Text along with detailed mathematical descriptions. Yellow discs or disc-segments show the dynamical variables in each model. Thick black arrows show fluxes of Ca2+ between compartments or fluxes between phospho-inositol moieties; arrows with no source or no target show Ca2+ fluxes from or to, respectively, the extra-cellular compartment. Dashed lines show positive (blue, arrow) and negative (magenta bar) influences; additional positive or negative influences may arise through the details of the mechanism behind each individual flux. Abbreviations are as in Fig 1A.
Fig 4
Fig 4. Method of nonlinear frequency analysis.
(A) From left to right: experimental (above) and simulated (below) non-stationary Ca2+ time courses in response to pulse stimulation are processed by independent algorithms (S1 Text) to identify peaks in the data (red dots). A common “spike filtering” algorithm determines which peaks correspond to spikes (binary 1) or skips (binary 0), thereby generating a binary string. A “pattern identification” algorithm then locates each occurrence of the skipping indicator, “10”, in the binary string and determines the skipping pattern as the fraction of 1’s in the total number of binary digits before the next skipping indicator, as shown for a hypothetical bitstring on the right. (B) Experimental skipping-pattern data over all measured cells in twelve pulse stimulation experiments (experiment numbers 4–15 in S1 Text). The ticks beneath the panel mark the corresponding patterns according to the key below. The top boundary of the panel is 70% and the numbers over the bars are percentages to the nearest 1%, with an asterisk denoting a value below 1%.
Fig 5
Fig 5. Nonlinear frequency analysis identifies classes of models.
(A)-(C) Histograms of skipping-pattern frequencies, laid out as in Fig 4B and named on the left. (A) Model simulations (red), using the names in Fig 3, under uniform sampling (left column) and lognormal sampling (right column). (B) Experimental data (EXP, black) reproduced from Fig 4B for convenience of comparison. (C) Population of binary strings generated by independently choosing each bit at random with equal probability (RAN, gold). (D) Plots of the distance measure Δ (blue) and the KS statistic (green) (Materials and Methods) for uniform (top) and lognormal (bottom) sampling, showing the difference between the experimental distribution and each of the eight models and the random histogram, as annotated below the bars.
Fig 6
Fig 6. Method of nonlinear amplitude analysis.
(A) Plots of cytoplasmic Ca2+ against time, in response to step stimulation, plotted underneath (red), for the AT1, LR1 and LR2 models, for the reference initial conditions (with initial Ca ER increased) and parameter values used in the original papers (S1 Text). (B) Measure of amplitude decay rate. Spike heights are plotted against time and the maximal (max) and minimal (min) heights over the time period are determined. A cut-off is set at the minimal height plus 1/4 of the difference between maximal and minimal. The number of spikes that occur before the cut-off is reached (red points) is taken as a measure of the rate at which amplitude decays. (C) Histogram of the amplitude decay rates over all measured cells in three step stimulation experiments (experiment numbers 1–3 in S1 Text). The inset shows a boxplot of the distribution, marked at the 25th percentile, median, 75th percentile, one standard deviation beyond the mean and outliers. The histogram is truncated at 15 spikes and the boxplot at 25 spikes.
Fig 7
Fig 7. Amplitude analysis rules out class 2 models.
(A) Histograms of the amplitude decay rates for all the models (for better comparison, a superimposed black contour of the experimental histogram in Fig 6C has been added to each panel). The histograms show the frequency with which a particular decay rate is found, under uniform (left) and lognormal (right) sampling of initial conditions and parameter values. (B) Distance measure Δ (left) and KS statistic (right) between the histograms of each of the 8 models and EXP for uniform (top) and lognormal (bottom) sampling.
Fig 8
Fig 8. Amplitude analysis of hybrid AT1-based models.
(A) Histograms of the amplitude decay rates, under uniform sampling (top) and under lognormal sampling (bottom), with a superimposed black contour of Fig 6C for easier comparison. Histograms 1–11 are from hybrid AT1 models, as described in the text, and histograms 12–14 are as annotated. (B) Metrics for the histograms in panel A.
Fig 9
Fig 9. Amplitude analysis of hybrid LR1-based models.
(A) Histograms of the amplitude decay rates for hybrid LR1-based models, under uniform sampling (top) and under lognormal sampling (bottom), laid out as in Fig 8. (B) Metrics for the histograms in panel A.
Fig 10
Fig 10. Gap detection with the AT1 model.
(A) Plots of cytoplasmic Ca2+ for three representative cells in three experiments in which a step increase in histamine was interrupted by two (expt. 21 & 23) or five (expt. 22) gaps, with the size of the gap changing between experiments as shown. The first two gaps are marked by a black diamond when the gap was detected, based on a manual scoring of any feature of the Ca2+ trajectory that showed a discernible change at the gap (S1 Text). The percentage of cells that detect the first gap steadily increases with gap size but cells 21-3, 21-8 and 22-171 are able to detect the second gap despite missing the first. (B) Plots of cytoplasmic Ca2+ (blue) and IP3 (black) for the AT1 model responding to a step increase in histamine interrupted by two gaps of 15 seconds. The initial Ca ER and the timescale for IP3 decay, τ, were chosen as shown (τ corresponds to ir−1 in S1 Text), with the other initial conditions and parameter values as in the original paper. As τ decreases below the gap duration, the second gap is detected when τ = 10 sec and then both gaps are detected when τ = 5 sec. (C) The middle simulation in B is repeated with initial Ca ER lowered from 19 μM to 15 μM and both gaps are then detected.

Similar articles

Cited by

References

    1. Clapham DE. Calcium signalling. Cell. 2007;131:1047–58. 10.1016/j.cell.2007.11.028 - DOI - PubMed
    1. Woods NM, Cuthbertson KSR, Cobbold PH. Repetitive transient rises in cytoplasmic free calcium in hormone-stimulated hepatocytes. Nature. 1986;319:600–2. 10.1038/319600a0 - DOI - PubMed
    1. Berridge MJ, Cobbold PH, Cuthbertson KSR. Spatial and temporal aspects of cell signalling. Phil Trans R Soc Lond B. 1988;320:325–43. 10.1098/rstb.1988.0080 - DOI - PubMed
    1. Berridge MJ, Lipp P, Bootman MD. The versatility and universality of calcium signalling. Nature Rev Mol Cell Biol. 2000;1:11–21. 10.1038/35036035 - DOI - PubMed
    1. Berridge MJ, Bootman MD, Roderick HL. Calcium signalling: dynamics, homeostasis and remodelling. Nature Rev Mol Cell Biol. 2003;4:517–29. 10.1038/nrm1155 - DOI - PubMed

Publication types

MeSH terms

LinkOut - more resources