. 2016 Jun 28;17(7):1022.
doi: 10.3390/ijms17071022.

Mechanisms Underlying Activation of α₁-Adrenergic Receptor-Induced Trafficking of AQP5 in Rat Parotid Acinar Cells under Isotonic or Hypotonic Conditions

Affiliations

Mechanisms Underlying Activation of α₁-Adrenergic Receptor-Induced Trafficking of AQP5 in Rat Parotid Acinar Cells under Isotonic or Hypotonic Conditions

Aneta M Bragiel et al. Int J Mol Sci. .

Abstract

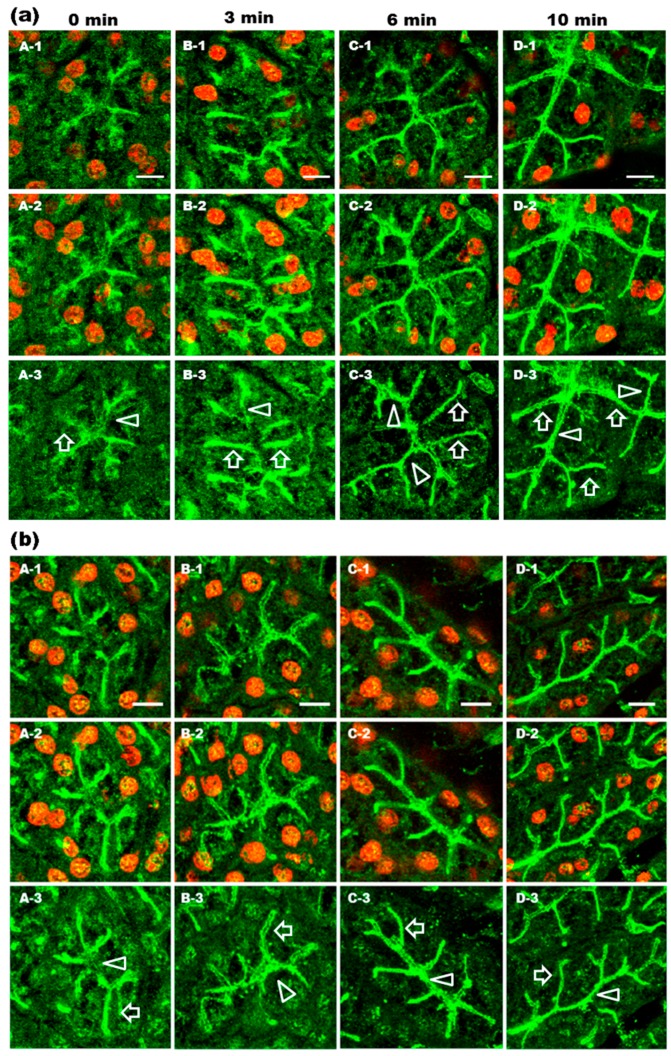
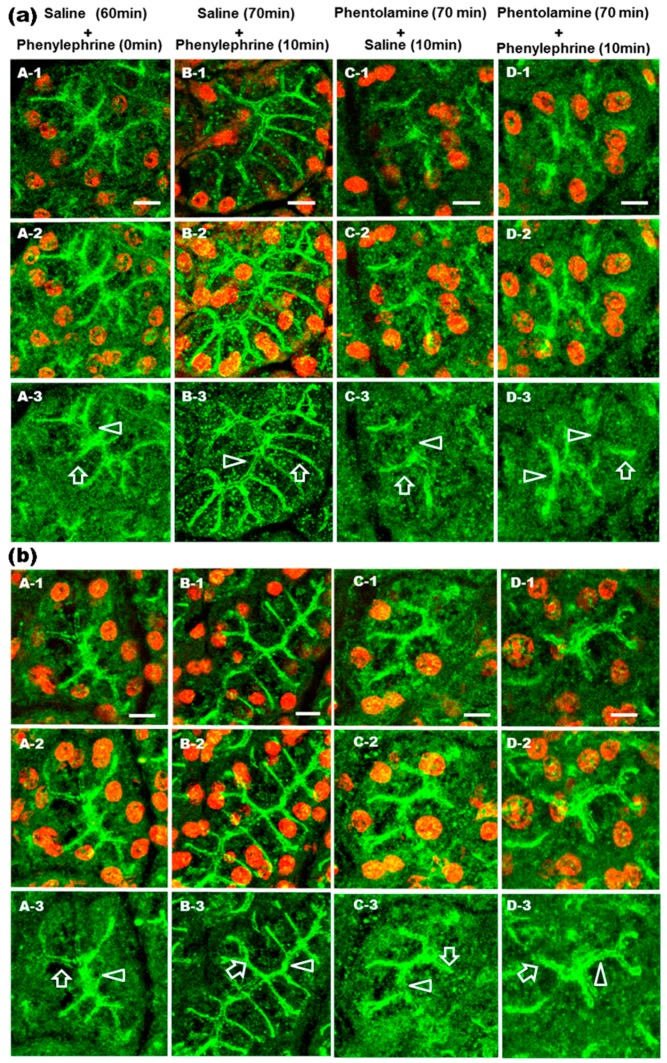
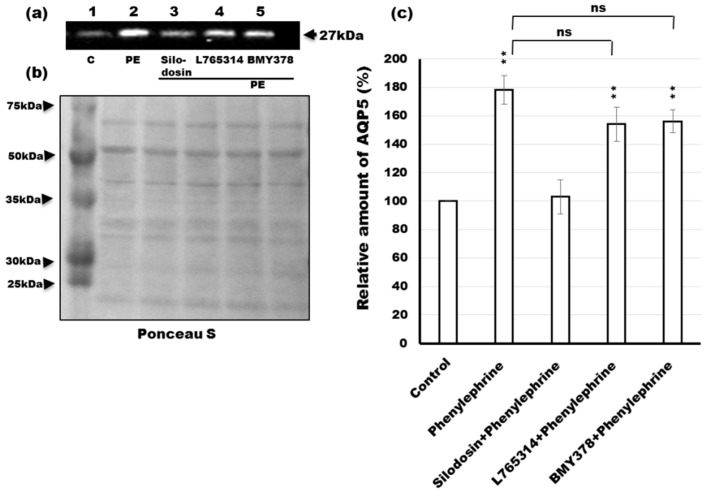
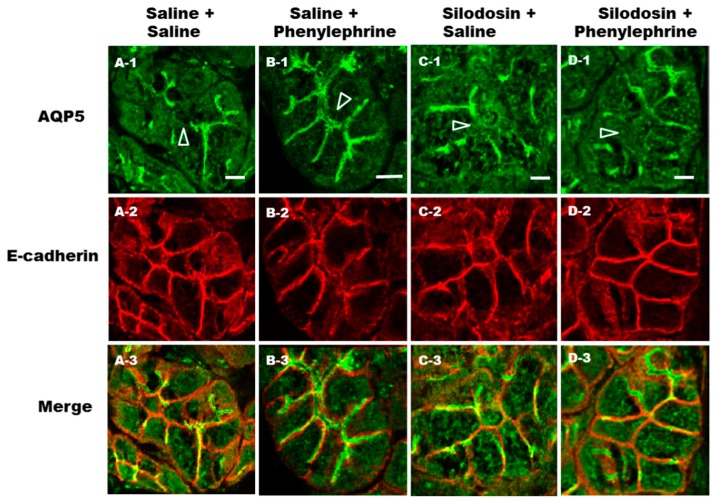
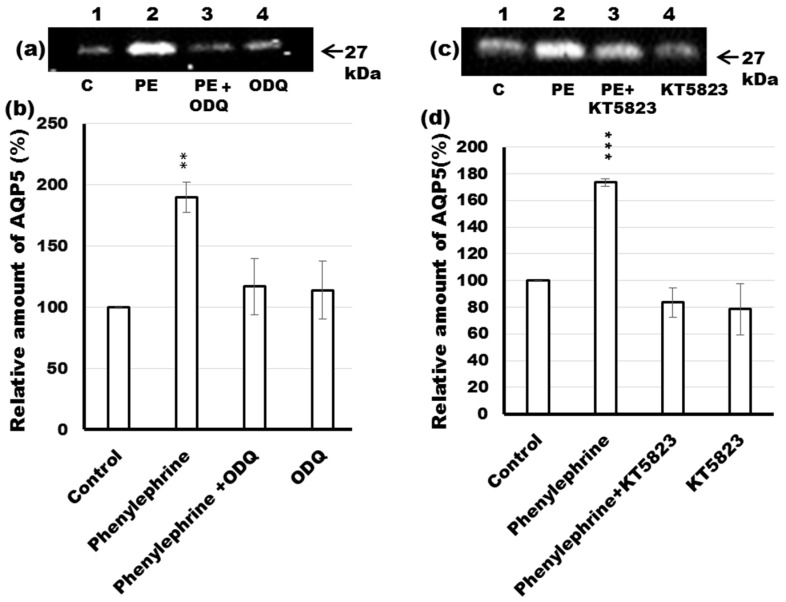
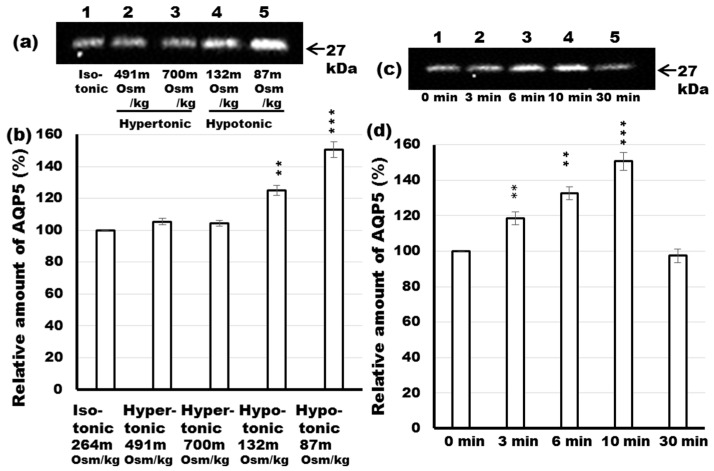
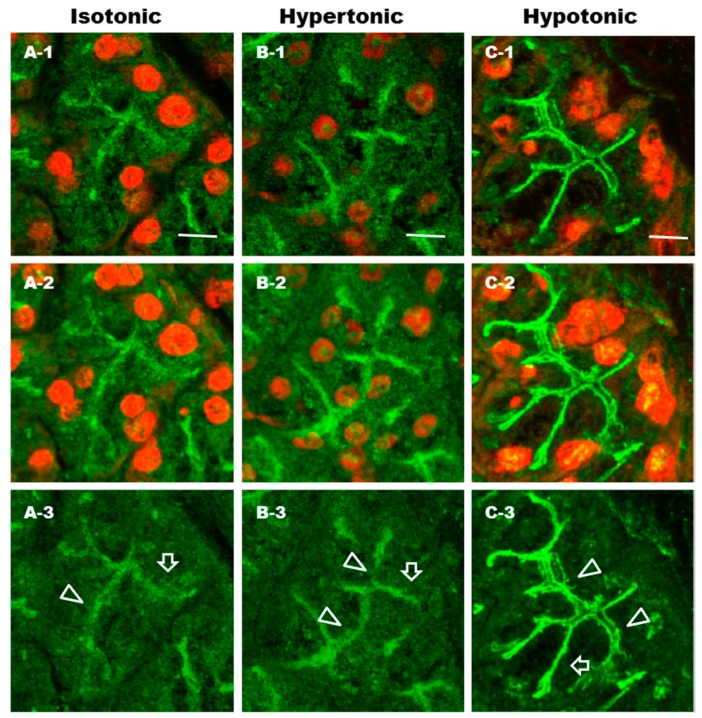
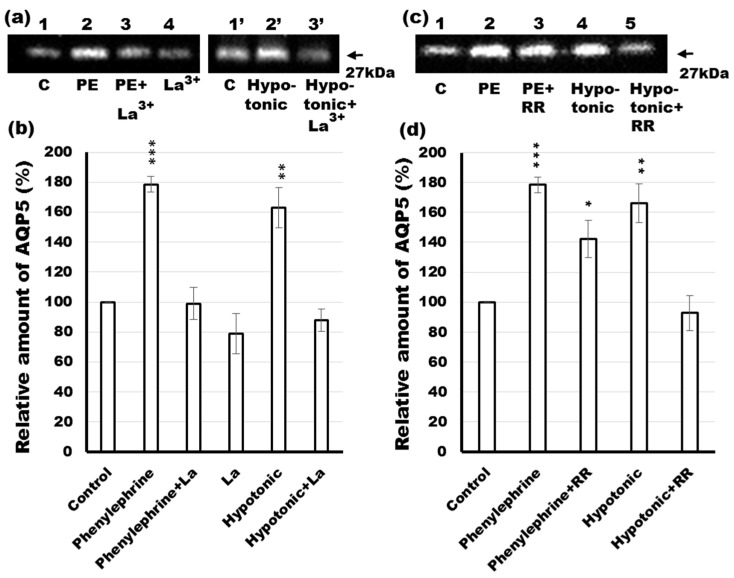
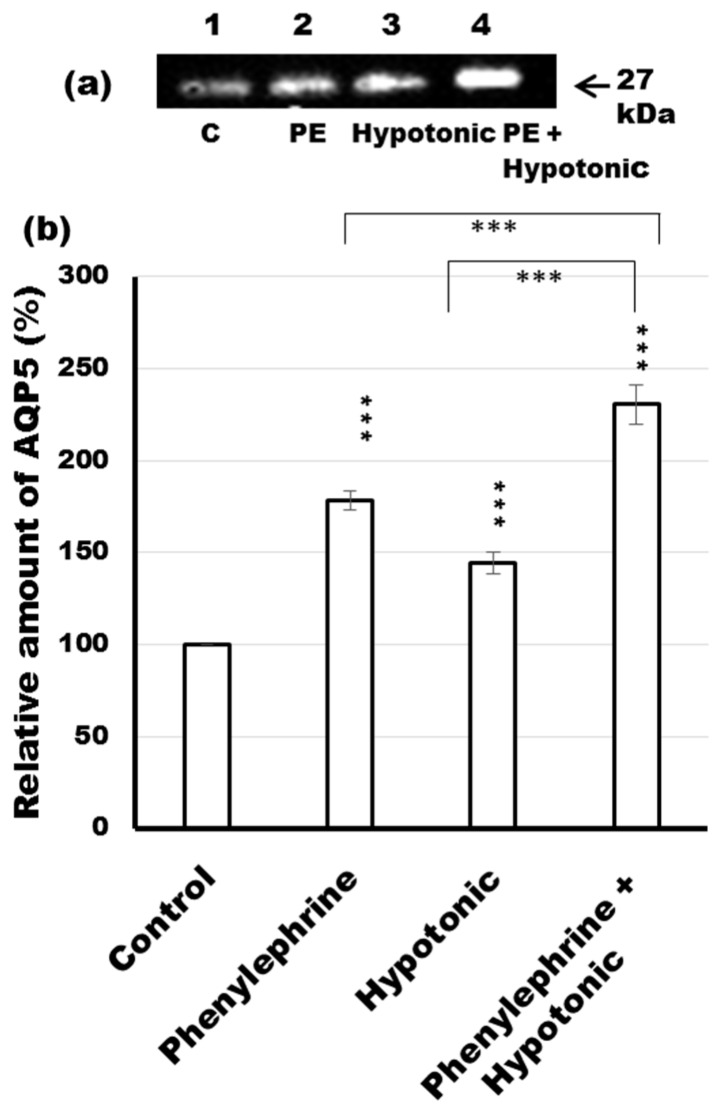
Defective cellular trafficking of aquaporin-5 (AQP5) to the apical plasma membrane (APM) in salivary glands is associated with the loss of salivary fluid secretion. To examine mechanisms of α₁-adrenoceptor (AR)-induced trafficking of AQP5, immunoconfocal microscopy and Western blot analysis were used to analyze AQP5 localization in parotid tissues stimulated with phenylephrine under different osmolality. Phenylephrine-induced trafficking of AQP5 to the APM and lateral plasma membrane (LPM) was mediated via the α1A-AR subtype, but not the α1B- and α1D-AR subtypes. Phenylephrine-induced trafficking of AQP5 was inhibited by ODQ and KT5823, inhibitors of nitric oxide (NO)-stimulated guanylcyclase (GC) and protein kinase (PK) G, respectively, indicating the involvement of the NO/ soluble (c) GC/PKG signaling pathway. Under isotonic conditions, phenylephrine-induced trafficking was inhibited by La(3+), implying the participation of store-operated Ca(2+) channel. Under hypotonic conditions, phenylephrine-induced trafficking of AQP5 to the APM was higher than that under isotonic conditions. Under non-stimulated conditions, hypotonicity-induced trafficking of AQP5 to the APM was inhibited by ruthenium red and La(3+), suggesting the involvement of extracellular Ca(2+) entry. Thus, α1A-AR activation induced the trafficking of AQP5 to the APM and LPM via the Ca(2+)/ cyclic guanosine monophosphate (cGMP)/PKG signaling pathway, which is associated with store-operated Ca(2+) entry.

Keywords: aquaporin-5; calcium; hypotonicity; protein G kinase; α1A-adrenoceptor; α1B-adrenoceptor; α1D-adrenoceptor.


Figures

Figure 1
Figure 1
Immunohistochemical analysis of aquaporin-5 (AQP5) and ganglioside GM1 distributions in rat parotid acinar cells after phenylephrine injection. Parotid glands were obtained from rats 0 (A), 3 (B), 6 (C), and 10 (D) min after phenylephrine (0.25 mg/kg) injection. Tissue sections were fixed in ethanol followed by incubation with anti-AQP5 (a) and anti-GM1 (b) antibodies. Alexa-488 was used to visualize AQP5 and GM1. Propidium iodide (PI) was used to stain nuclei. One section is presented in each single image (−1). Sixteen consecutive images produced by a confocal microscope were projected to generate a single image (−2). To get clear visualization of AQP5 localization in acinar cells, the 568 nm laser was turned off (−3). Arrow heads and arrows indicate apical plasma membrane (APM) and lateral plasma membrane (LPM), respectively. Scale bars: 10 µm.
Figure 2
Figure 2
Immunohistochemical analysis of AQP5 and GM1 distributions in rat parotid acinar cells after phenylephrine and phentolamine injection. Rats were intraperitoneally injected with phentolamine (10 mg/kg) (C and D) or saline (A and B). After 60 min, phenylephrine (0.25 mg/kg) (B and D) was intravenously injected. Parotid glands were obtained from rats 0 (A) and 10 (BD) min after phenylephrine or saline injection. Alexa-488 was used to visualize AQP5 (a) and GM1 (b). PI was used to stain nuclei. One section is presented in each single image (−1). Sixteen consecutive images produced by a confocal microscope were projected to generate a single image (−2). To get clear visualization of AQP5 localization in the acinar cells, the 568 nm laser was turned off (−3). Arrow heads and arrows indicate APM and LPM, respectively. Scale bars: 10 µm.
Figure 3
Figure 3
Effects of α1-AR subtype antagonists on phenylephrine-induced increases in AQP5 levels in the APM. (a) Tissue slices from rat parotid glands were incubated for 10 min at 37 °C without (lane 1) or with 1 µM phenylephrine (PE) (lanes 2–5) plus 10 µM silodosin (lane 3), 10 µM L765314 (lane 4) and 10 µM BMY7378 (lane 5). The 5 µg of APM fraction protein was then loaded on sodium dodecyl sulfate polyacrylamide gel electrophoresis (SDS-PAGE) and processed by immunoblot analysis with anti-AQP5 antibody; (b) The blotted membrane was stained by Ponceau S; (c) Densitometric analysis was carried out normalizing to total protein amount by staining nitrocellulose membrane with Ponceau S solution. The amount of AQP5 in the APM, measured by the intensity of chemiluminescence, was shown as a percentage of the value for control tissue. Values are expressed as mean ± SE of three independent experiments. ** p < 0.01 vs. the value for control tissue. ns: not significant.
Figure 4
Figure 4
Immunohistochemical analysis of AQP5 and E-cadherin distributions in rat parotid acinar cells after phenylephrine and silodosin administration. Rats were treated with silodosin (a daily dose of 1 mg/kg p.o.) (C and D) or saline (A and B) once daily for 1 week. Subsequently, phenylephrine (0.25 mg/kg) (B and D) or saline (A and C) was intravenously injected and parotid glands were subjected to immunohistochemical analysis with anti-AQP5 and anti-E-cadherin antibodies. Secondary antibodies coupled to Alexa-488 or 568 were used to visualize AQP5 (A-1 to D-1) and E-cadherin (A-2 to D-2), respectively. Arrow heads indicate APM. Scale bars: 10 µm.
Figure 5
Figure 5
Effects of the antagonists ODQ and KT5823 on phenylephrine-induced increases in AQP5 levels in the APM. (a) Tissue slices from rat parotid glands were incubated for 10 min at 37 °C in the absence (lanes 1 and 4) or presence of 1 µM phenylephrine (lanes 2 and 3) plus 10 µM ODQ (lanes 3 and 4). The 5 µg of APM fraction protein was loaded on SDS-PAGE and processed by immunoblot analysis with anti-AQP5 antibody. Densitometric analysis was carried out normalizing to total protein amount by staining membrane with Ponceau S solution. The membrane stained with Ponceau S was shown in Figure S1; (b) The amount of AQP5 in the APM, measured by the intensity of chemiluminescence, was shown as a percentage of the value for control tissue; (c) Tissue slices from rat parotid glands were incubated for 10 min at 37 °C in the absence (lanes 1 and 4) or presence of 1 µM phenylephrine (lanes 2 and 3) plus and 10 µM KT5823 (lanes 3 and 4). The 5 µg of APM fraction protein was loaded on SDS-PAGE and processed by immunoblot analysis with anti-AQP5 antibody; (d) Densitometric analysis was carried out normalizing to total protein amount by staining membrane with Ponceau S solution. The amount of AQP5 in the APM, measured by the intensity of chemiluminescence, was shown as a percentage of the value for control tissue. Values are expressed as mean ± SE of three independent experiments. ** p < 0.01, *** p < 0.01 vs. the value for control tissue.
Figure 6
Figure 6
Effect of hypotonicity or hypertonicity on the translocation of AQP5 in rat parotid glands. (a) Tissue slices from rat parotid glands were incubated for 10 min at 37 °C in isotonic (lane 1), hypertonic (lanes 2 and 3) and hypotonic (lanes 4 and 5) solutions. Hypertonic and hypotonic solutions were made by addition of higher tonicity solution and by dilution with water, respectively. The 5 µg of APM fraction protein was loaded on SDS-PAGE and processed by immunoblot analysis with anti-AQP5 antibody; (b) Densitometric analysis was carried out normalizing to total protein amount by staining membrane with Ponceau S solution and values were expressed as a percentage of the control. The membrane stained with Ponceau S was shown in Figure S1. Values are expressed as mean ± SE of three to six independent experiments; (c) Parotid tissue was incubated for 0, 3, 6, 10, and 30 min in hypotonic solution (87 mOsm/kg) (lanes 1–5). At the designated times, the tissue was homogenized, the APM was isolated and 5 µg of sample was subjected to immunoblot analysis with anti-AQP5 antibody; (d) Densitometric analysis was carried out normalizing to total protein amount by staining membrane with Ponceau S solution and values were shown as a percentage of the control. The membrane stained with Ponceau S was shown in Figure S1. Values are expressed as mean ± SE of three independent experiments. ** p < 0.01, *** p < 0.001 vs. control (lane 1).
Figure 7
Figure 7
Immunohistochemical analysis of AQP5 distribution in rat parotid acinar cells under isotonic, hypertonic and hypotonic conditions. Parotid gland tissue sections were incubated for 10 min at 37 °C in isotonic (A), hypertonic (B) and hypotonic (C) solutions. Tissue sections were fixed in ethanol followed by incubation with anti-AQP5 antibody. Secondary antibody coupled to Alexa-488 was used to visualize AQP5. PI was used to stain nuclei. One section is presented in each single image (−1). Sixteen consecutive images produced by a confocal microscope were projected to generate a single image (−2). To get clear visualization of the AQP5 localization in acinar cells, the 568 nm laser was turned off (−3). Arrow heads and arrows indicate APM and LPM, respectively. Scale bars: 10 µm.
Figure 8
Figure 8
Effects of lanthanum chloride (La3+) and ruthenium red (RR) on phenylephrine- or hypotonicity-induced increases in AQP5 levels in the APM. (a) Tissue slices from rat parotid glands were incubated for 10 min at 37 °C in isotonic (lanes 1-4 and 1’) or hypotonic (lanes 2’ and 3’) solution without (lanes 1 and 4) or with 1 µM phenylephrine (lanes 2 and 3) plus 3 mM La3+ (lanes 3, 3’ and 4). The 5 µg of APM fraction protein was prepared and processed by immunoblot analysis with anti-AQP5 antibody; (b) Densitometric analysis was carried out normalizing to total protein amount by staining membrane with Ponceau S solution and values were expressed as a percentage of the control. The membrane stained with Ponceau S was shown in Figure S1; (c) Tissue slices from the glands were incubated for 10 min at 37 °C in control (lane 1), phenylephrine (lane 2), phenylephrine with RR (lane 3), hypotonic (lane 4) and hypotonic with phenylephrine solutions (lane 4). The osmolality of the solutions were 261 mOsm/kg (lanes 1–3) and 87 mOsm/kg (lanes 4 and 5) with 1 µM of phenylephrine and 10 µM of RR as the final concentration. The 5 µg of APM fraction protein was loaded on SDS-PAGE and processed by immunoblot analysis with anti-AQP5 antibody; (d) Densitometric analysis was carried out normalizing to total protein amount by staining membrane with Ponceau S solution and values were expressed as a percentage of the control. Values are expressed as mean ± SE of three to six independent experiments. * p < 0.05, ** p < 0.01, *** p < 0.001 vs. control.
Figure 9
Figure 9
Phenylephrine-induced translocation of AQP5 in rat parotid tissues under hypotonicity. (a) Tissue slices from rat parotid glands were incubated for 10 min at 37 °C in control (lane 1), phenylephrine (lane 2), hypotonic (lane 3) and hypotonic with phenylephrine (lane 4) solutions. The osmolality of the solutions were 261 mOsm/kg (lanes 1, 2) and 87 mOsm/kg (lanes 3, 4) with 1 µM of phenylephrine as a final concentration. The 5 µg of APM fraction protein was loaded on SDS-PAGE and processed by immunoblot analysis with anti-AQP5 antibody; (b) Densitometric analysis was carried out normalizing to total protein amount by staining membrane with Ponceau S solution and values were expressed as a percentage of the control. The membrane stained with Ponceau S was shown in Figure S1. Values are expressed as mean ± SE of three independent experiments. *** p < 0.001 vs. control.

Similar articles

Cited by

References

    1. Proctor G.B., Carpenter G.H. Regulation of salivary gland function by autonomic nerves. Auton. Neurosci. 2007;133:3–18. doi: 10.1016/j.autneu.2006.10.006. - DOI - PubMed
    1. Ambudkar I.S. Ca2+ signaling and regulation of fluid secretion in salivary gland acinar cells. Cell Calcium. 2014;55:297–305. doi: 10.1016/j.ceca.2014.02.009. - DOI - PMC - PubMed
    1. Nielsen S., Kwon T.H., Frokiaer J., Agre P. Regulation and dysregulation of aquaporins in water balance disorders. J. Intern. Med. 2007;261:53–64. doi: 10.1111/j.1365-2796.2006.01760.x. - DOI - PubMed
    1. Ishibashi K., Kondo S., Hara S., Morishita Y. The evolutionary aspects of aquaporin family. Am. J. Physiol. Regul. Integr. Comp. Physiol. 2011;300:R566–R576. doi: 10.1152/ajpregu.90464.2008. - DOI - PubMed
    1. Raina S., Preston G.M., Guggino W.B., Agre P. Molecular cloning and characterization of an aquaporin cDNA from salivary, lacrimal, and respiratory tissues. J. Biol. Chem. 1995;270:1908–1912. - PubMed

MeSH terms

LinkOut - more resources