. 2016 Jun;95(26):e3929.
doi: 10.1097/MD.0000000000003929.

Time series analysis of influenza incidence in Chinese provinces from 2004 to 2011

Affiliations

Time series analysis of influenza incidence in Chinese provinces from 2004 to 2011

Xin Song et al. Medicine (Baltimore). 2016 Jun.

Abstract

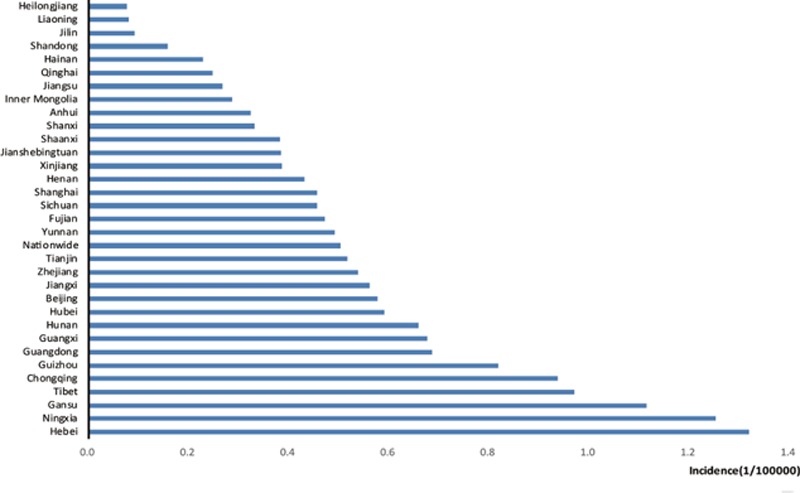
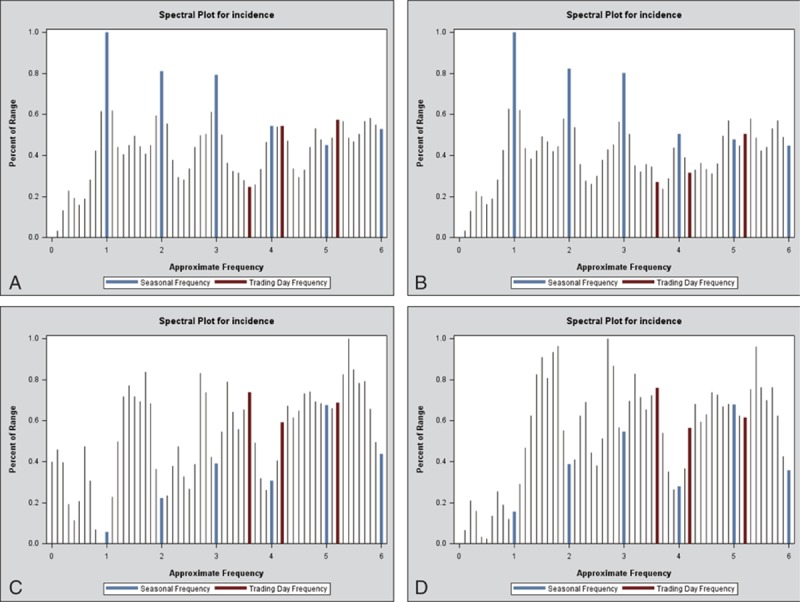
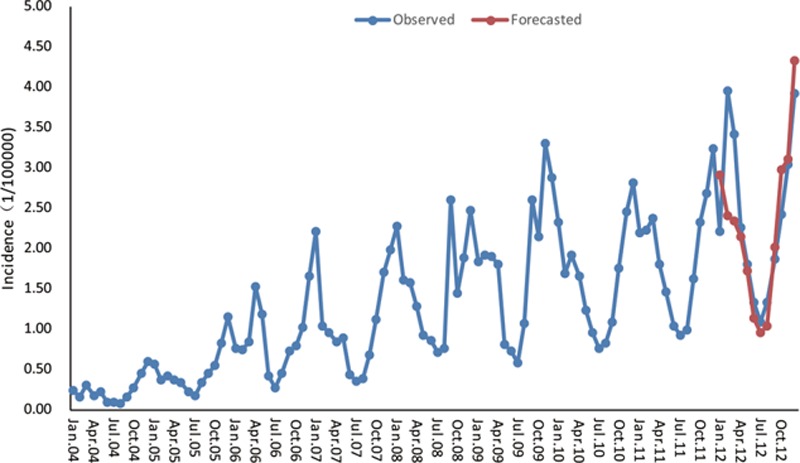
Influenza as a severe infectious disease has caused catastrophes throughout human history, and every pandemic of influenza has produced a great social burden. We compiled monthly data of influenza incidence from all provinces and autonomous regions in mainland China from January 2004 to December 2011, comprehensively evaluated and classified these data, and then randomly selected 4 provinces with higher incidence (Hebei, Gansu, Guizhou, and Hunan), 2 provinces with median incidence (Tianjin and Henan), 1 province with lower incidence (Shandong), using time series analysis to construct an ARIMA model, which is based on the monthly incidence from 2004 to 2011 as the training set. We exerted the X-12-ARIMA procedure for modeling due to the seasonality these data implied. Autocorrelation function (ACF), partial autocorrelation function (PACF), and automatic model selection were to determine the order of the model parameters. The optimal model was decided by a nonseasonal and seasonal moving average test. Finally, we applied this model to predict the monthly incidence of influenza in 2012 as the test set, and the simulated incidence was compared with the observed incidence to evaluate the model's validity by the criterion of both percentage variability in regression analyses (R) and root mean square error (RMSE). It is conceivable that SARIMA (0,1,1)(0,1,1)12 could simultaneously forecast the influenza incidence of the Hebei Province, Guizhou Province, Henan Province, and Shandong Province; SARIMA (1,0,0)(0,1,1)12 could forecast the influenza incidence in Gansu Province; SARIMA (3,1,1)(0,1,1)12 could forecast the influenza incidence in Tianjin City; and SARIMA (0,1,1)(0,0,1)12 could forecast the influenza incidence in Hunan Province. Time series analysis is a good tool for prediction of disease incidence.


Conflict of interest statement

The authors have no conflicts of interest to disclose.

Figures

Figure 1
Figure 1
Monthly average influenza incidence (1/100,000) from 2004 to 2011 in all provinces in mainland China.
Figure 2
Figure 2
Monthly influenza incidence (1/100,000) nationwide in mainland China from January 2004 to December 2011.
Figure 3
Figure 3
Time series for monthly influenza incidence (1/100,000) in the Hebei Province from January 2004 to December 2011.
Figure 4
Figure 4
Autocorrelation functions (ACF) and partial autocorrelation functions (PACF) of model residuals at different nonseasonal and seasonal differencing for monthly influenza incidence from January 2004 to December 2011 in the Hebei Province: (A) nonseasonal difference = 0, seasonal difference = 0; (B) nonseasonal difference = 0, seasonal difference = 1; (C) nonseasonal difference = 1, seasonal difference = 0; (D) nonseasonal difference = 1, seasonal difference = 1.ACF, autocorrelation functions, PACF = partial autocorrelation functions.
Figure 5
Figure 5
Spectrum plot for monthly influenza incidence (1/100,000) from 2004 to 2011 in the Hebei Province by the X-12-ARIMA procedure: (A) spectral plot for original data; (B) spectral plot of the differenced, transformed original series; (C) spectrum plot for the differenced, transformed seasonally adjusted data; (D) spectrum plot for the modified irregular data. ARIMA = autoregressive integrated moving average.
Figure 6
Figure 6
SARIMA (0,1,1)(0,1,1)12-fitted influenza time series (Jan. 2004–Dec. 2011) and forecasted incidence (Jan. 2012–Dec. 2012) in the Hebei Province. The blue dotted line represents the observed values of influenza incidence from 2004 to 2012, and the red dotted line represents the SARIMA (0,1,1)(0,1,1)12 model's fitted curve of 2012. SARIMA = seasonal autoregressive integrated moving average.
Figure 7
Figure 7
SARIMA (p,d,q)(P,D,Q)s-fitted influenza time series (Jan. 2004–Dec. 2011) and forecasted incidence (Jan. 2012–Dec. 2012) in different Provinces/Cities. The blue dotted line represents the observed values of influenza incidence from 2004 to 2012, and the red dotted line represents the constructed model's fitted curve of 2012. SARIMA (p,d,q)(P,D,Q)s can be used for the short-term forecast of the influenza incidence. (A) SARIMA (1,0,0)(0,1,1)12-fitted influenza time series (Jan. 2004–Dec. 2011) and forecasted incidence (Jan. 2012–Dec. 2012) in the Gansu Province. (B) SARIMA (0,1,1)(0,1,1)12-fitted influenza time series (Jan. 2004–Dec. 2011) and forecasted incidence (Jan. 2012–Dec. 2012) in the Guizhou Province. (C) SARIMA (0,1,1)(0,0,1)12-fitted influenza time series (Jan. 2004–Dec. 2011) and forecasted incidence (Jan. 2012–Dec. 2012) in the Hunan Province. (D) SARIMA (3,1,1)(0,1,1)12-fitted influenza time series (Jan. 2004–Dec. 2011) and forecasted incidence (Jan. 2012–Dec. 2012) in the Tianjin City. (E) SARIMA (0,1,1)(0,1,1)12-fitted influenza time series (Jan. 2004–Dec. 2011) and forecasted incidence (Jan. 2012–Dec. 2012) in the Henan Province. (F) SARIMA (0,1,1)(0,1,1)12-fitted influenza time series (Jan. 2004–Dec. 2011) and forecasted incidence (Jan. 2012–Dec. 2012) in the Shandong Province. SARIMA = seasonal autoregressive integrated moving average.

Similar articles

Cited by

References

    1. Word Health Organization (WHO) media centre (http://www.who.int/mediacentre/factsh eets/fs211/en/) Accessed March 2014.
    1. Johnson NP, Mueller J. Updating the accounts: global mortality of the 1918–1920 “Spanish” influenza pandemic. Bull Hist Med 2002; 76:105–115. - PubMed
    1. Nguyen-Van-Tam JS, Hampson AW. The epidemiology and clinical impact of pandemic influenza. Vaccine 2003; 21:1762–1768. - PubMed
    1. Alonso WJ, Vibound C, Simonsen L, et al. Seasonality of influenza in Brazil: a traveling wave from the Amazon to the subtropics. Am J Epidemiol 2007; 165:1434–1442. - PubMed
    1. Box GE, Jekins GM, Reinsel GC. Time Series Analysis: Forecasting and Control. 4th edn. 2008; New Jersey: John Wiley & Sons, 645–660.