. 2016 Jun 30;166(1):126-39.
doi: 10.1016/j.cell.2016.05.042.

Paracrine Induction of HIF by Glutamate in Breast Cancer: EglN1 Senses Cysteine

Affiliations

Paracrine Induction of HIF by Glutamate in Breast Cancer: EglN1 Senses Cysteine

Kimberly J Briggs et al. Cell. .

Abstract

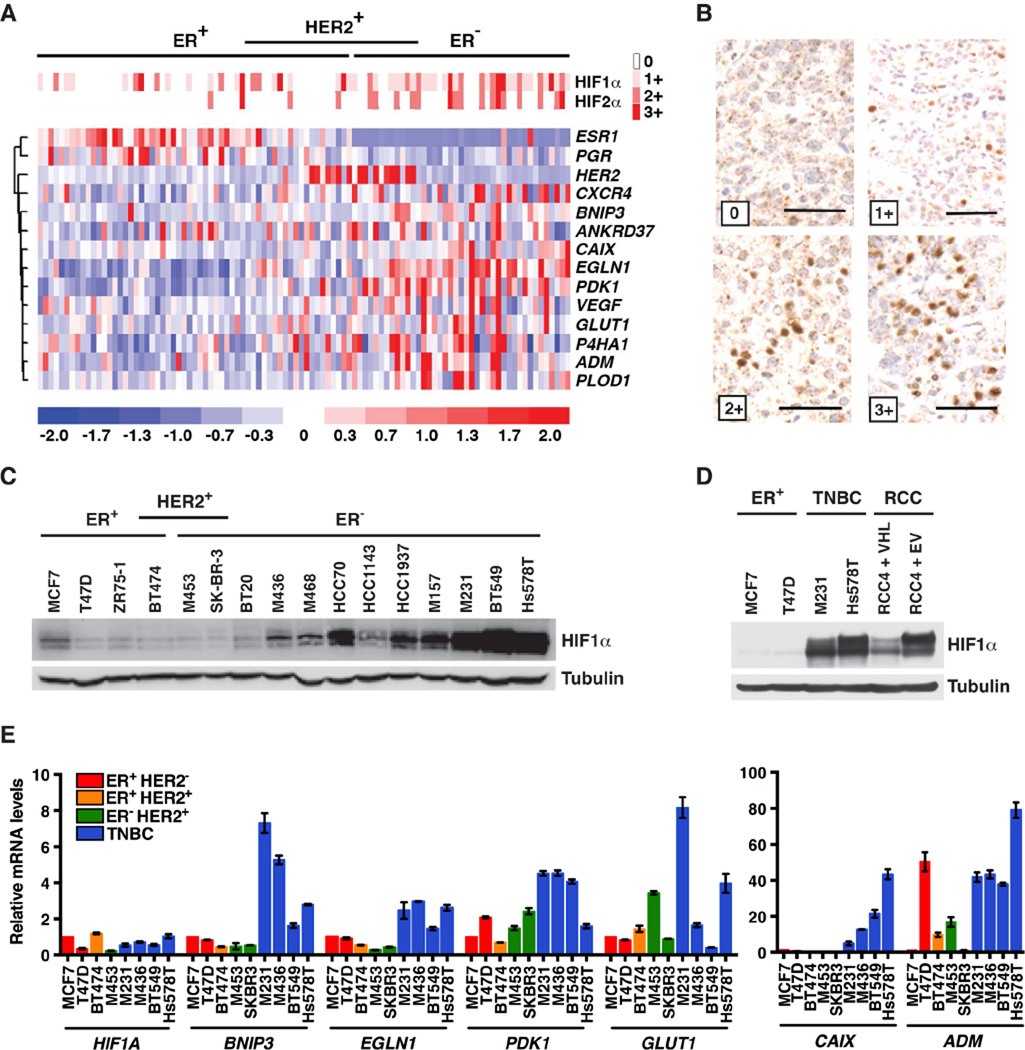
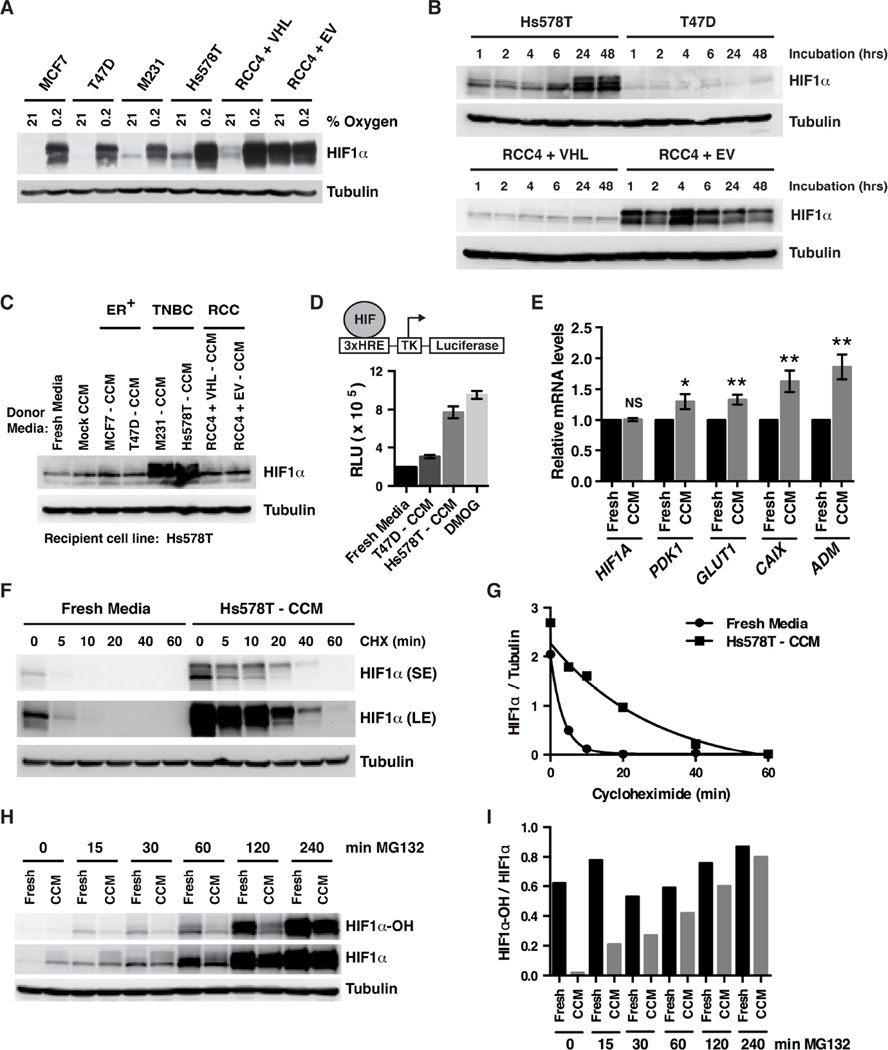
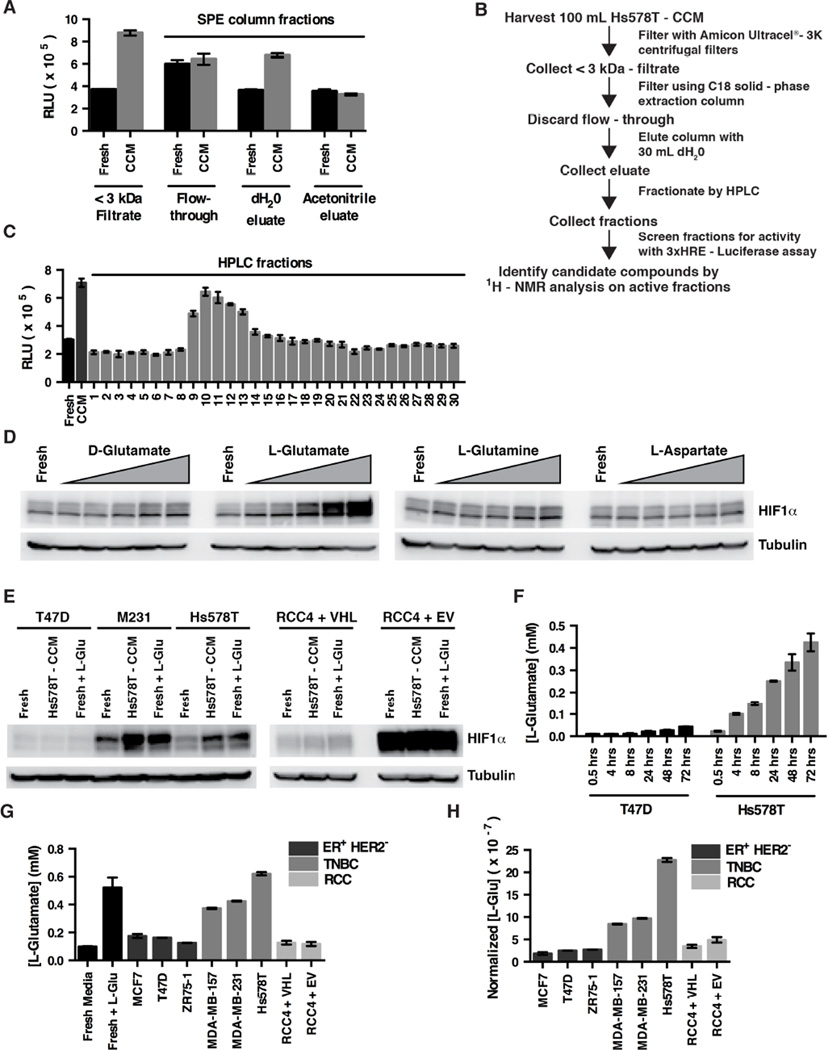
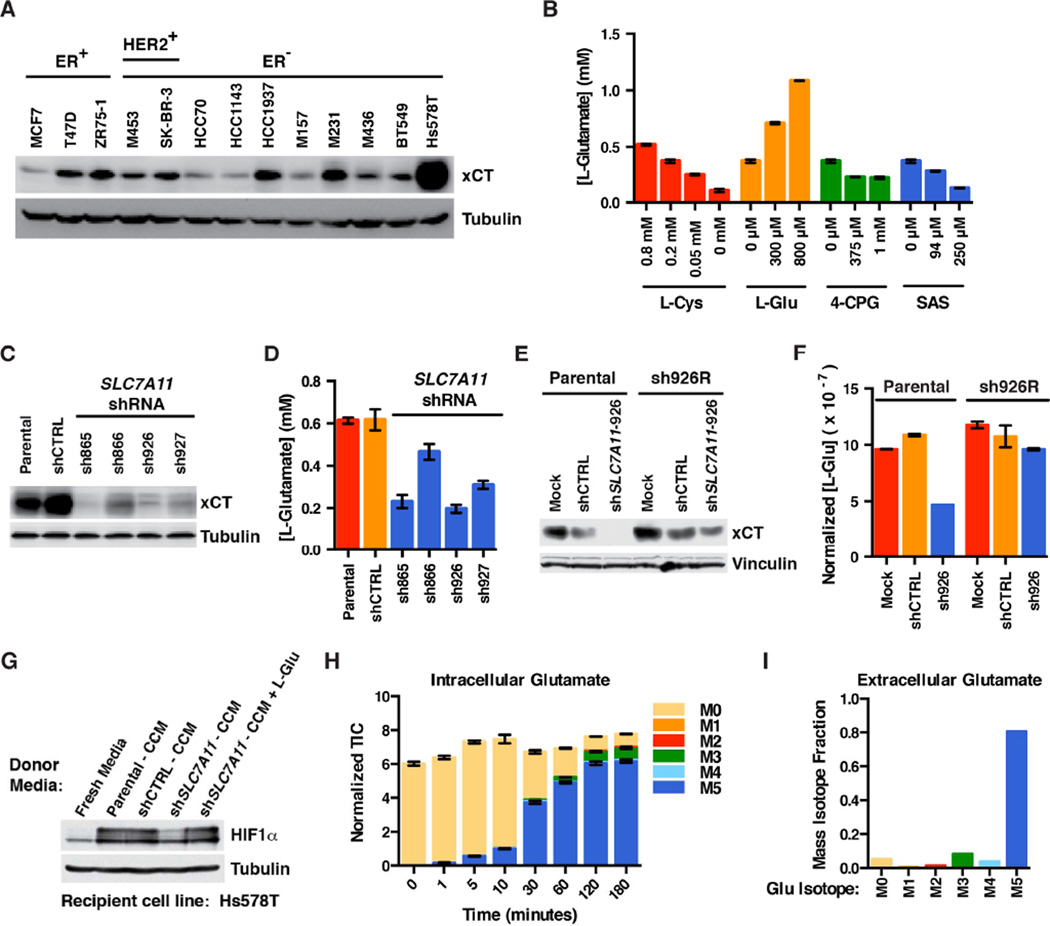
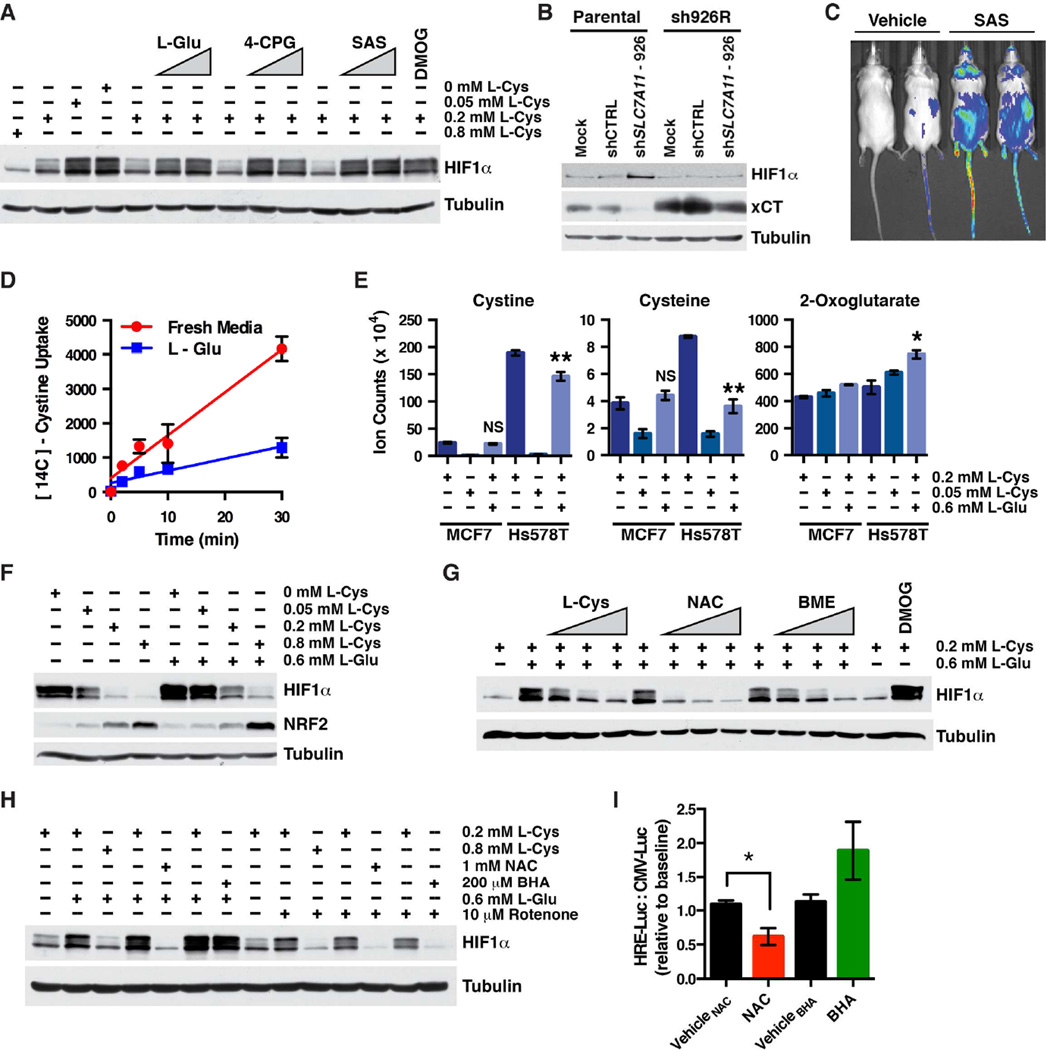
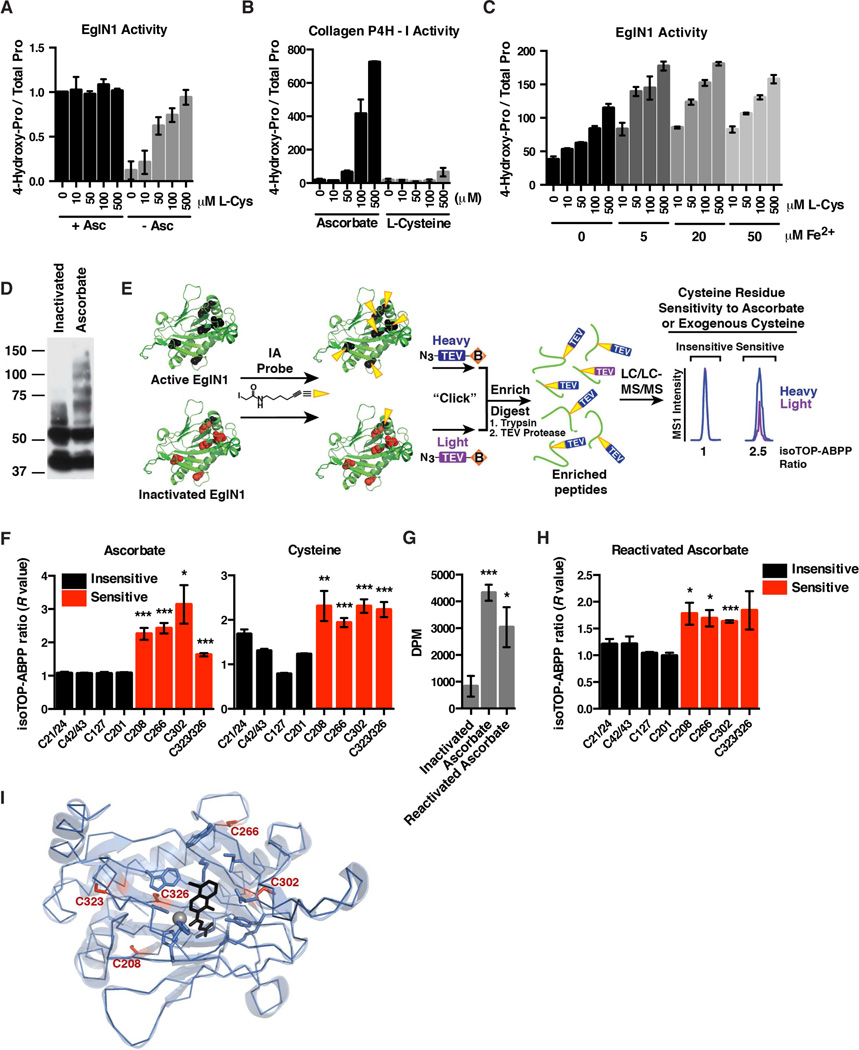
The HIF transcription factor promotes adaptation to hypoxia and stimulates the growth of certain cancers, including triple-negative breast cancer (TNBC). The HIFα subunit is usually prolyl-hydroxylated by EglN family members under normoxic conditions, causing its rapid degradation. We confirmed that TNBC cells secrete glutamate, which we found is both necessary and sufficient for the paracrine induction of HIF1α in such cells under normoxic conditions. Glutamate inhibits the xCT glutamate-cystine antiporter, leading to intracellular cysteine depletion. EglN1, the main HIFα prolyl-hydroxylase, undergoes oxidative self-inactivation in the absence of cysteine both in biochemical assays and in cells, resulting in HIF1α accumulation. Therefore, EglN1 senses both oxygen and cysteine.


Figures

Figure 1
Figure 1. HIF Is Upregulated in Triple-Negative Breast Cancer
(A) Heat maps depicting relative abundance of HIFα protein levels (top) and selected mRNAs (bottom), in a series of breast tumor specimens. Samples are arranged into subsets according to immunohistochemical staining for ER (Estrogen Receptor) and HER2, and each column refers to one specimen. (B) Representative HIF1α immunohistochemistry from (A). Scale bar = 50 µm. (C–E) Immunoblot (C–D) and real-time PCR analysis (E) of the indicated breast cancer lines. RCC4 VHL−/− renal carcinoma cells infected to produce wild-type pVHL (VHL) or with the empty vector (EV) were included in (D) for comparison. M453, MDA-MB-453; M436, MDA-MB-436; M468, MDA-MB-468; M157, MDA-MB-157; M231, MDA-MB-231; RCC, renal cell carcinoma. In (E) transcript levels were normalized to ACTB, and then to the corresponding value in MCF7 cells. Data are represented as mean ± SEM. See also Figure S1.
Figure 2
Figure 2. TNBC Cells Secrete a Small Molecule HIF1α Stabilizer
(A) Immunoblot analysis of breast [MCF7, T47D, MDA-MB-231 (M231) and Hs578T] and renal (RCC4) cancer cell lines cultured in the presence of 21% oxygen or 0.2% oxygen for 6 hrs. (B) Immunoblot analysis of breast (Hs578T and T47D) and renal (RCC4) cancer cell lines at the indicated timepoints after being plated in fresh media. (C) Immunoblot analysis of Hs578T cells exposed for 6 hours to fresh media or media either incubated for 48 hours in the absence of cells (Mock) or conditioned by the indicated breast [MCF7, T47D, MDA-MB-231 (M231), Hs578T] or renal (RCC4) cell lines. CCM = cell-conditioned media. (D) Luciferase activity of Hs578T cells expressing firefly luciferase (FLuc) under the control of a HIF-responsive promoter (3xHRE) after 6 hours exposure to fresh media, media conditioned by the indicated cell lines or fresh media supplemented with 1 mM DMOG. Data are represented as mean ± SEM. (E) Real-time PCR analysis of Hs578T cells cultured in either HS578T-conditioned media or fresh media for 6 hours. Transcript levels were normalized to ACTB, and then to the corresponding value for “Fresh Media.” Data are represented as mean ± SEM. NS refers to not statistically significant, * refers to p-value < 0.05, ** refers to p-value < 0.01. (F and H) Immunoblot analysis of Hs578T cells grown in fresh media or Hs578T-CCM. 100 µg/mL Cycloheximide (F) or 10 µM MG132 (H) was added for the indicated duration before cell lysis. (G and I) Quantification of band intensities from (F and H). See also Figure S2.
Figure 3
Figure 3. L-Glutamate Secreted by TNBC is Sufficient to Induce HIF1α
(A and C) FLuc activity of Hs578T cells expressing FLuc under the control of the 3xHRE promoter after 6 hours exposure to the indicated partially purified fractions derived from Hs578T-CCM. Panel (A) shows data from the SPE-column elutions. Panel (C) shows data from the HPLC fractions. Data are represented as mean ± SEM. (B) Schema for purifying HIF1α-inducing factor from Hs578T-CCM. (D) Immunoblot analysis of Hs578T cells grown for 4 hours in fresh standard culture media (containing 4 mM L-glutamine and 0.2 mM L-cystine) supplemented with increasing concentrations of the indicated amino acids. Triangle indicates 0.075, 0.15, 0.3, 0.6, and 1.2 mM. (E) Immunoblot analysis of breast [T47D, MDA-MB-231 (M231), Hs578T] and renal (RCC4) cancer cell lines cultured in fresh media, Hs578T-CCM, or fresh media supplemented with 0.6 mM L-glutamate. (F) L-glutamate concentrations in cell culture media conditioned by T47D cells or Hs578T cells for the indicated timepoints. Data are represented as mean ± SEM. (G and H) L-glutamate concentrations in cell culture media conditioned by the indicated cell lines for 72 hours. Fresh media (Fresh) or fresh media supplemented with 0.6 mM L-glutamate (+L-Glu) serve as controls. Cells were plated in order to achieve similar confluence at 72 hours. In (H) data were normalized to cell number. Data are represented as mean ± SEM. See also Figure S2.
Figure 4
Figure 4. xCT Is Required for Glutamate Secretion by TNBC
(A) Immunoblot analysis of the indicated breast cancer lines. (B) L-glutamate concentration in cell culture media conditioned by Hs578T cells treated with the indicated concentrations of L-cystine (L-Cys), L-glutamate (L-Glu), or the xCT inhibitors (S)4-carboxyphenylglycine (4-CPG) or sulfasalazine (SAS) for 24 hours. All media contained 0.2 mM L-Cys except where indicated. Data are represented as mean ± SEM. (C and E) Immunoblot of Hs578T cells infected with lentiviruses encoding the indicated SLC7A11 shRNAs or a control (CTRL) shRNA. In (E) either parental Hs578T cells or cells stably expressing an exogenous SLC7A11 cDNA resistant to SLC7A11 shRNA-926 (sh926R) were infected with lentiviruses encoding SLC7A11 shRNA-926 (sh926) or a control shRNA (shCTRL), or underwent a mock infection in the absence of lentivirus (Mock). (D and F) L-glutamate concentrations in cell culture media conditioned by the cell lines used in (C) and (E), respectively, for 48 hours. In (F) L-glutamate quantifications were normalized to total cell number. Data are represented as mean ± SEM. (G) Immunoblot analysis of Hs578T treated with conditioned media from cells from (C) and (D). Where indicated exogenous L-glutamate was added to the CCM to a final concentration of 0.6 mM. (H and I) 13C-labeled intracellular (H) and extracellular (I) glutamate detected after growing Hs578T cells either for the indicated timepoints (H), or 24 hours (I) in media containing uniformly labeled (M5) 13C-glutamine. Ion counts in for each mass isotopomer in (H) were normalized to an internal standard. Data are represented as mean ± SEM (H), or representative of two independent experiments (I). See also Figure S3.
Figure 5
Figure 5. Inhibition of xCT Depletes Cysteine and Induces HIF
(A) Immunoblot of Hs578T cells grown in fresh media supplemented with the indicated concentrations of L-cystine (L-Cys) and increasing concentrations of either L-glutamate (L-Glu; 300 and 800 µM), the xCT inhibitors (S)4-carboxyphenylglycine (4-CPG; 0.375 and 1 mM) or sulfasalazine (SAS; 94 and 250 µM), or the EglN inhibitor, DMOG (0.1 mM) for 4 hours. (B) Immunoblot analysis of cells prepared as in Figure 4E. (C) Representative dorsal bioluminescent images (BLI) of HIF1α-luciferase mice after two doses of 250 mg/kg sulfasalazine (SAS) or vehicle. Images were obtained 18 hours after the first dose. (D) Cystine uptake in Hs578T cells grown in fresh media or media supplemented with 0.6 mM L-glutamate. Data are represented as mean ± SEM. (E) Intracellular levels of the indicated metabolites, as determined by LC-MS, for MCF7 and Hs578T cells cultured in the presence of the indicated concentrations of L-cystine and L-glutamate. Data are represented as mean ± SEM, * refers to p-value < 0.05, and ** refers to p-value < 0.01. (F) Immunoblot of Hs578T grown in media containing the indicated concentrations of L-cystine (L-Cys) and L-glutamate (L-Glu). (G and H) Immunoblot analysis of Hs578T cells grown for 4 hours in media containing additives at the indicated concentrations, and for (G), increasing concentrations of L-cystine (L-Cys; to a final concentration of 0.4, 0.6 and 0.8 mM), N-acetylcysteine (NAC; 0.2, 0.5, and 1.0 mM) and β-mercaptoethanol (BME; 20, 50 and 100 µM). (I) Change in FLuc activity, as determined by BLI, of orthotopic Hs578T cell tumors expressing FLuc driven by the 3xHRE promoter after treating mice with NAC, BHA, or their respective vehicles. For each mouse the values were first normalized to the BLI signal from a contralateral orthotopic Hs578T cell tumor expressing FLuc driven by a constitutive promoter (CMV) and then divided by the corresponding pretreatment ratio for that mouse. See also Figures S4 and S5.
Figure 6
Figure 6. Cysteine Maintains EglN1 Activity by Preventing Oxidation of Specific Intramolecular Cysteine Residues
(A and B) In vitro EglN1 activity (A) or collagen-4-prolyl hydroxylase-1 activity (B) in the presence or absence of ascorbate, and increasing L-cysteine concentrations. Data shown are represented as mean ± SEM of four independent experiments (A), or two independent experiments (B). Data in (A) were first normalized to the value for “0 µM L-Cys + Asc.” (C) In vitro activity of EglN1 supplemented with increasing concentrations of Lcysteine (L-Cys) and ferrous iron. Data shown are representative of two independent experiments. (D) Immunoblot of self-inactivated or active recombinant EglN1 after covalent attachment of PEG-maleimide followed by SDS-PAGE. EglN1 activity was maintained using ascorbate. (E) EglN1 isoTOP-ABPP schematic. Active or inactivated recombinant EglN1 samples are treated with cysteine-directed iodoacetamide-alkyne probe (IA) (reduced cysteine residues represented in black, oxidized cysteine residues represented in red). The samples are then conjugated to isotopically differentiated TEV protease-cleavable biotin tags [light (purple) and heavy (blue)] by click chemistry and mixed. The IA-labeled proteins are enriched using streptavidin-conjugated beads, and digested stepwise on-bead with trypsin and TEV to yield IA-labeled peptides for MS analysis. Competition ratios or R values are measured by dividing the MS1 ion peaks for IA-labeled peptides in active (ascorbate-treated) (heavy, or blue) versus inactivated (light, or purple) samples. (F and H) Iodoacetamide alkyne-labeling of cysteine residues in full-length, recombinant EglN1. Residues sensitive to ascorbate or exogenous cysteine are indicated by an increase in the isoTOP-ABPP ratio (red bars). Data are represented as mean ± SEM. * refers to p-value < 0.05, ** refers to p-value < 0.01, *** refers to p-value < 0.001. (G) In vitro activity of recombinant EglN1 in the absence of ascorbate (Inactivated), the presence of ascorbate, or activity of previously inactivated EglN1 following reactivation with ascorbate (Reactivated Ascorbate). Data shown are represented as mean ± SEM of four independent experiments. * refers to p-value < 0.05, *** refers to p-value < 0.001. (I) Crystal structure of EglN1 catalytic domain (PDB ID: 2G19) showing location of the reactive cysteine residues, iron (gray sphere), and a 2-OG-competitive EglN inhibitor, N-[(4-hydroxy-8-iodoisoquinolin-3-YL)carbonyl]glycine (black). See also Figure S6.

References

    1. Andras IE, Deli MA, Veszelka S, Hayashi K, Hennig B, Toborek M. The NMDA and AMPA/KA receptors are involved in glutamate-induced alterations of occludin expression and phosphorylation in brain endothelial cells. Journal of cerebral blood flow and metabolism : official journal of the International Society of Cerebral Blood Flow and Metabolism. 2007;27:1431–1443. - PubMed
    1. Blouw B, Song H, Tihan T, Bosze J, Ferrara N, Gerber HP, Johnson RS, Bergers G. The hypoxic response of tumors is dependent on their microenvironment. Cancer Cell. 2003;4:133–146. - PubMed
    1. Bos R, van Der Hoeven JJ, van Der Wall E, van Der Groep P, van Diest PJ, Comans EF, Joshi U, Semenza GL, Hoekstra OS, Lammertsma AA, et al. Biologic correlates of (18)fluorodeoxyglucose uptake in human breast cancer measured by positron emission tomography. J Clin Oncol. 2002;20:379–387. - PubMed
    1. Chaturvedi P, Gilkes DM, Wong CC, Kshitiz, Luo W, Zhang H, Wei H, Takano N, Schito L, Levchenko A, et al. Hypoxia-inducible factor-dependent breast cancer-mesenchymal stem cell bidirectional signaling promotes metastasis. J Clin Invest. 2013;123:189–205. - PMC - PubMed
    1. Chen X, Iliopoulos D, Zhang Q, Tang Q, Greenblatt MB, Hatziapostolou M, Lim E, Tam WL, Ni M, Chen Y, et al. XBP1 promotes triple-negative breast cancer by controlling the HIF1alpha pathway. Nature. 2014;508:103–107. - PMC - PubMed

Publication types

MeSH terms