. 2016 Jul 1;18(1):70.
doi: 10.1186/s13058-016-0728-y.

Genome co-amplification upregulates a mitotic gene network activity that predicts outcome and response to mitotic protein inhibitors in breast cancer

Affiliations

Genome co-amplification upregulates a mitotic gene network activity that predicts outcome and response to mitotic protein inhibitors in breast cancer

Zhi Hu et al. Breast Cancer Res. .

Erratum in

Abstract

Background: High mitotic activity is associated with the genesis and progression of many cancers. Small molecule inhibitors of mitotic apparatus proteins are now being developed and evaluated clinically as anticancer agents. With clinical trials of several of these experimental compounds underway, it is important to understand the molecular mechanisms that determine high mitotic activity, identify tumor subtypes that carry molecular aberrations that confer high mitotic activity, and to develop molecular markers that distinguish which tumors will be most responsive to mitotic apparatus inhibitors.

Methods: We identified a coordinately regulated mitotic apparatus network by analyzing gene expression profiles for 53 malignant and non-malignant human breast cancer cell lines and two separate primary breast tumor datasets. We defined the mitotic network activity index (MNAI) as the sum of the transcriptional levels of the 54 coordinately regulated mitotic apparatus genes. The effect of those genes on cell growth was evaluated by small interfering RNA (siRNA).

Results: High MNAI was enriched in basal-like breast tumors and was associated with reduced survival duration and preferential sensitivity to inhibitors of the mitotic apparatus proteins, polo-like kinase, centromere associated protein E and aurora kinase designated GSK462364, GSK923295 and GSK1070916, respectively. Co-amplification of regions of chromosomes 8q24, 10p15-p12, 12p13, and 17q24-q25 was associated with the transcriptional upregulation of this network of 54 mitotic apparatus genes, and we identify transcription factors that localize to these regions and putatively regulate mitotic activity. Knockdown of the mitotic network by siRNA identified 22 genes that might be considered as additional therapeutic targets for this clinically relevant patient subgroup.

Conclusions: We define a molecular signature which may guide therapeutic approaches for tumors with high mitotic network activity.

Keywords: Breast cancer; Mitotic index; Novel therapeutics; Predictive biomarker.


Figures

Fig. 1
Fig. 1
A conserved mitotic apparatus network in breast cancer cell lines and tumors. Transcripts with expression levels that correlated significantly with the expression levels of either PLK1, CENPE, or AURKB in 53 breast cancer cell lines (ArrayExpress (http://www.ebi.ac.uk/arrayexpress/) with accession number E-TABM-157) were identified. A relevance network was constructed based on the correlation between the resultant genes (272 Affymetrix probes), with edges drawn between significantly correlated genes (nodes). The mitotic gene network derived in the breast cancer cell lines was also confirmed in primary breast tumors from dataset 1 (as Chin et al) and dataset 2 (as GSE2034).
Fig. 2
Fig. 2
Mitotic network activity is elevated in a subset of breast cancers. Mitotic network activity index (MNAI) defined as the sum of the expression levels of the 54 mitotic network genes. Heatmaps illustrate mitotic network gene expression in breast cell lines (n = 53) [23] (basal vs. luminal subtype), p < 0.0001 (a), primary breast tumors from dataset 1 (n = 101) p < 0.001 (b), and primary tumors in the dataset from Curtis dataset. (n = 1980), p < 0.00001 (c), between basal and luminal tumors (PAM50) and integrated cluster 10 (IC10) vs. other subgroups (ICs) based on analysis of variance. LumA luminal A, LumB luminal B, Her2 human epidermal growth factor receptor 2, ER estrogen receptor
Fig. 3
Fig. 3
Association between mitotic network activity and survival time. Kaplan-Meier curves are shown for tumors with the highest one third of mitotic network activity index (MNAI) values and the lowest one third of MNAI values. Higher mitotic network activity was significantly associated with reduced survival time in four independent breast cancer studies based on the log-rank test. a Dataset 1, p < 0.05. b Dataset 2, p < 0.0005. c Dataset 3, p < 0.0001. d Dataset 4, p < 0.0001
Fig. 4
Fig. 4
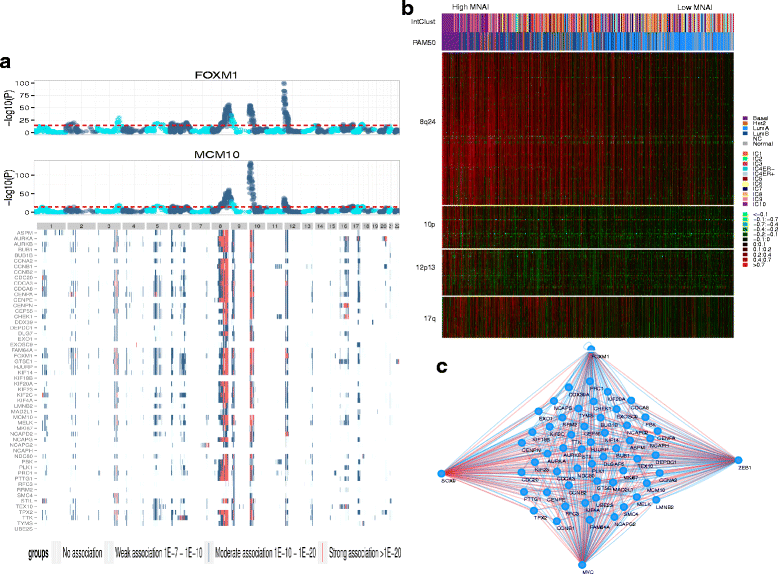
Genetic loci associated with mitotic network gene expression levels. a Genome-wide somatic copy number alterations associated with the expression of two mitotic network genes (FOXM1 and MCM10) are illustrated in a Manhattan plot (upper panels) above a heatmap indicating the strength of the association between mitotic network gene expression and genome-wide somatic copy number alterations in the dataset from Curtis et al. Each row in the heatmap represents a gene in the mitotic network and each column represents a chromosomal locus defined by merged copy number regions. P values indicating the significance of the association were based on analysis of variance for each gene, where red denotes genomic alterations strongly associated with the expression of mitotic network genes (p < 10−20), blue indicates moderate significance (10−20 < p < 10−10) and green shows significant, but slightly weaker association (10−10 < p < 10−7). b Heatmap representation of somatic copy number alterations for loci significantly associated with the expression of mitotic network genes. Amplified regions on chromosome 8q24 (120–132 Mb), 10p15-p12 (0–17.8 Mb), 12p13 (0–4 Mb), and 17q24-q25 (55.4–78.5 Mb) are indicated, where samples have been ordered by their mitotic network activity index. c These loci include the transcription factors MYC, ZEB1, FOXM1 and SOX9, each of which has predicted binding sites in multiple mitotic network genes, where edges connecting transcription factors to mitotic network genes based on binding site predictions are indicated in red and sites verified by ChIP-seq are shown in blue. MNAI mitotic network activity index
Fig. 5
Fig. 5
Dose response in breast cancer subtypes. Responses to GSK462364, GSK923295, and GSK1070916 were assayed for compounds individually or in combination in cell lines representing different breast cancer subtypes. a Responses in cell lines with a high mitotic network activity index (MNAI) and a low MNAI, and b responses in basal and luminal breast cancer cell lines were assessed using the two-tailed Mann-Whitney U test. c Responses to GSK462364, GSK923295 and GSK1070916 administered individually or in pairwise combination in breast cancer cell lines with high (HCC38) or low (MDAMB175) MNAI
Fig. 6
Fig. 6
Small interfering RNA (siRNA) knockdown of mitotic network genes in the breast cancer cell line MDAMB231. Cells were transiently transfected with siRNAs targeting mitotic apparatus genes and cell viability, and mRNA levels were assayed. a Cell viability was measured after 72 hours and normalized to non-specific siRNA, which served as a negative control. siRNAs that induced significant growth inhibition (p < 0.05) relative to a control siRNA based on the two-tailed Student’s t test are indicated. b mRNA levels were quantified after siRNA knockdown by normalizing to mRNA levels after treatment with a control siRNA

References

    1. Gaillard H, García-Muse T, Aguilera A. Replication stress and cancer. Nat Rev Cancer. 2015;15:276–89. doi: 10.1038/nrc3916. - DOI - PubMed
    1. Vader G, Lens SM. The Aurora kinase family in cell division and cancer. Biochim Biophys Acta. 1785;2008:50–72. - PubMed
    1. Curtis C. Genomic profiling of breast cancers. Curr Opin Obstet Gynecol. 2015;27(1):34–9. doi: 10.1097/GCO.0000000000000145. - DOI - PMC - PubMed
    1. Carter SL, Eklund AC, Kohane IS, Harris LN, Szallasi Z. A signature of chromosomal instability inferred from gene expression profiles predicts clinical outcome in multiple human cancers. Nat Genet. 2006;38:1043–8. doi: 10.1038/ng1861. - DOI - PubMed
    1. Medri L, Volpi A, Nanni O, Vecci AM, Mangia A, Schittulli F, et al. Prognostic relevance of mitotic activity in patients with node-negative breast cancer. Mod Pathol. 2003;15:1057–75. - PubMed

MeSH terms