. 2016 Jul 1;17(1):144.
doi: 10.1186/s13059-016-1010-4.

GiniClust: detecting rare cell types from single-cell gene expression data with Gini index

Affiliations

GiniClust: detecting rare cell types from single-cell gene expression data with Gini index

Lan Jiang et al. Genome Biol. .

Abstract

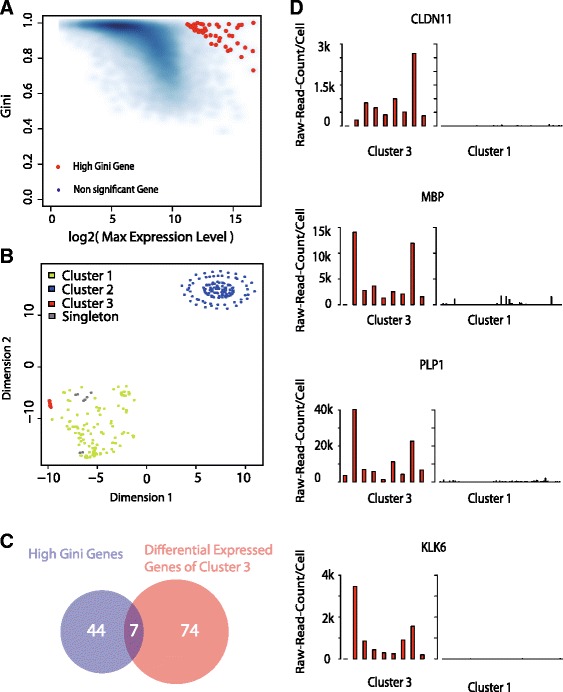
High-throughput single-cell technologies have great potential to discover new cell types; however, it remains challenging to detect rare cell types that are distinct from a large population. We present a novel computational method, called GiniClust, to overcome this challenge. Validation against a benchmark dataset indicates that GiniClust achieves high sensitivity and specificity. Application of GiniClust to public single-cell RNA-seq datasets uncovers previously unrecognized rare cell types, including Zscan4-expressing cells within mouse embryonic stem cells and hemoglobin-expressing cells in the mouse cortex and hippocampus. GiniClust also correctly detects a small number of normal cells that are mixed in a cancer cell population.

Keywords: Clustering; Gini index; RNA-seq; Rare cell type; Single-cell analysis; qPCR.


Figures

Fig. 1
Fig. 1
Coparison between Gini index and Fano factor in detecting differentially expressed genes. a Scaled density plot of the expression levels of genes X (red) and Y (blue). The proportion of the minor cell type is 50 %. b The Lorenz curve for genes X (red) and Y (blue). The proportion of the minor cell type is 50 %. c, d Same as (a, b), except the proportion of the minor cell type is changed to 1e-5. e Fano factor for genes X and Y for varying proportions of the minor cell type (1/1 M stands for one in one million). f Gini index for genes X and Y for varying proportions of the minor cell type
Fig. 2
Fig. 2
Overview of the GiniClust pipeline. Details are described in Methods
Fig. 3
Fig. 3
GiniClust uncovers rare cell types from the qPCR dataset. a Relationship between the raw Gini index and the log2-transformed maximum expression level. Selected genes with high normalized Gini index values are labeled as red dots. b Overlap between the selected high Gini genes and differentially expressed genes. c t-SNE visualization of the data. Cells are color-coded based on the GiniClust cluster membership. d t-SNE visualization of the same data as in c. Cells are color-coded based on the actual lineage. e Expression levels of representative genes for MASC (n = 24), ISC (n = 23), and other cells (n = 1916). Gene expression levels are normalized as percentage of the corresponding maximum values. f Comparison between GiniClust and RaceID in detection of ISC and MASCs in the mixture of cells
Fig. 4
Fig. 4
GiniClust identifies a Zscan4-enriched rare cluster from mouse embryonic stem cells. a Relationship between the raw Gini index and the log2-transformed maximum expression level. Selected genes with high normalized Gini index values are labeled as red dots. b t-SNE visualization of the data. Cells are color-coded based on the GiniClust cluster membership. Inset shows a zoomed-in region around the rare cell cluster. c Overlap between the selected high Gini genes and upregulated genes in Cluster 2. d Expression pattern of representative genes (Tcstv1, Dcdc2c, Zscan4f, Zscan4d) in Cluster 2 (n = 3, left panels) compared to Cluster 1 (n = 2505, right panels). Each bar represents a single cell
Fig. 5
Fig. 5
GiniClust identifies a rare cluster in glioblastoma samples. a Relationship between the raw Gini index and the log2-transformed maximum expression level. Selected genes with high normalized Gini index values are labeled as red dots. b t-SNE visualization of the data. Cells are color-coded based on the GiniClust cluster membership. c Overlap between the selected high Gini genes and upregulated genes in Cluster 2. d Expression pattern of representative genes (CLDN11, MBP, PLP1, KLK6) in Cluster 3 (n = 9, left panels) compared to Cluster 1 (n = 261, right panels). Each bar represents a single cell
Fig. 6
Fig. 6
GiniClust identifies a rare cell type in mouse cortex and hippocampus. a Relationship between the raw Gini index and the log2-transformed maximum expression level. Selected genes with high normalized Gini index values are labeled as red dots. b t-SNE visualization of the data. Cells are color-coded based on the GiniClust cluster membership. c Overlap between the selected high Gini genes and upregulated genes in Cluster 4. d Expression pattern of representative genes (Hba-a2, Hbb-b2, Hbb-bs) in Cluster 4 (n = 3, left panels) compared to Cluster 1 (n = 1842, right panels). Each bar represents a single cell. The expression levels of Hba-a2 shown here represent the sum of the levels of Hba-a2_loc1 and Hba-a2_loc2 in the original paper

References

    1. Lukk M, Kapushesky M, Nikkila J, Parkinson H, Goncalves A, Huber W, et al. A global map of human gene expression. Nat Biotechnol. 2010;28:322–4. doi: 10.1038/nbt0410-322. - DOI - PMC - PubMed
    1. Saadatpour A, Lai S, Guo G, Yuan GC. Single-cell analysis in cancer genomics. Trends Genet. 2015;31:576–86. doi: 10.1016/j.tig.2015.07.003. - DOI - PMC - PubMed
    1. Stegle O, Teichmann SA, Marioni JC. Computational and analytical challenges in single-cell transcriptomics. Nat Rev Genet. 2015;16:133–45. doi: 10.1038/nrg3833. - DOI - PubMed
    1. Zeisel A, Munoz-Manchado AB, Codeluppi S, Lonnerberg P, La Manno G, Jureus A, et al. Brain structure. Cell types in the mouse cortex and hippocampus revealed by single-cell RNA-seq. Science. 2015;347:1138–42. doi: 10.1126/science.aaa1934. - DOI - PubMed
    1. Wilson NK, Kent DG, Buettner F, Shehata M, Macaulay IC, Calero-Nieto FJ, et al. Combined single-cell functional and gene expression analysis resolves heterogeneity within stem cell populations. Cell Stem Cell. 2015;16:712–24. doi: 10.1016/j.stem.2015.04.004. - DOI - PMC - PubMed

Publication types