Practice Guideline
. 2016 Jul;43(7):4209.
doi: 10.1118/1.4947547.

The report of Task Group 100 of the AAPM: Application of risk analysis methods to radiation therapy quality management

Affiliations
Practice Guideline

The report of Task Group 100 of the AAPM: Application of risk analysis methods to radiation therapy quality management

M Saiful Huq et al. Med Phys. 2016 Jul.

Abstract

The increasing complexity of modern radiation therapy planning and delivery challenges traditional prescriptive quality management (QM) methods, such as many of those included in guidelines published by organizations such as the AAPM, ASTRO, ACR, ESTRO, and IAEA. These prescriptive guidelines have traditionally focused on monitoring all aspects of the functional performance of radiotherapy (RT) equipment by comparing parameters against tolerances set at strict but achievable values. Many errors that occur in radiation oncology are not due to failures in devices and software; rather they are failures in workflow and process. A systematic understanding of the likelihood and clinical impact of possible failures throughout a course of radiotherapy is needed to direct limit QM resources efficiently to produce maximum safety and quality of patient care. Task Group 100 of the AAPM has taken a broad view of these issues and has developed a framework for designing QM activities, based on estimates of the probability of identified failures and their clinical outcome through the RT planning and delivery process. The Task Group has chosen a specific radiotherapy process required for "intensity modulated radiation therapy (IMRT)" as a case study. The goal of this work is to apply modern risk-based analysis techniques to this complex RT process in order to demonstrate to the RT community that such techniques may help identify more effective and efficient ways to enhance the safety and quality of our treatment processes. The task group generated by consensus an example quality management program strategy for the IMRT process performed at the institution of one of the authors. This report describes the methodology and nomenclature developed, presents the process maps, FMEAs, fault trees, and QM programs developed, and makes suggestions on how this information could be used in the clinic. The development and implementation of risk-assessment techniques will make radiation therapy safer and more efficient.


Figures

FIG. 1.
FIG. 1.
Example of a fault tree. The figure shows a process with four inputs, each with QC to maintain the integrity of the process, and QA to provide confidence that the output of the process is correct. The red and green symbols represent “or” and “and” gates, respectively. Because an error in any of the four inputs can propagate into an error in the calculation, they all enter into the process through an or gate (red symbol). Parallel to each of the boxes indicating errors in the inputs are boxes indicating failure of QC associated with the process. Each of the “failure of QC” boxes enter an and gate (green symbol) with their respective error in input box. This indicates that for the error in the input to pass into the calculation process, there must be a concomitant failure of the QC that works on that input.
FIG. 2.
FIG. 2.
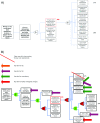
(a) An IMRT process tree, (b) magnified view of the initial treatment planning directive branch. The red numbers indicate (hazard ranking) the most hazardous 20%–25% of the steps as indicated by high risk priority number values. Steps with high severity hazards are shown in green. [See text and Sec. VIII (Ref. 64) for details.] A hazard is something that can cause harm. A risk is the chance, high or low, that any hazard will actually cause somebody harm.
FIG. 3.
FIG. 3.
Example of a fault tree for determining what could go wrong in pretreatment imaging for CTV localization. (See text for details.)
FIG. 4.
FIG. 4.
A plot of the hypothetical situation of various percentage errors in the FMEA parameters as described in the text. The RPN value has been divided by 100 to match the scale.
FIG. 5.
FIG. 5.
Process map for IMRT in the absence of any quality management. The black arrows show the normal flow of the process, proceeding from left to right on the largest scale and from outward to inward within a given step. The red numbers indicate (hazard ranking) the most hazardous 20%–25% of the steps as indicated by high risk priority number values. For example, a number of 8 next to a step indicates that that step is the 8th most hazardous step within the 20% most risky categories. A step with several numbers indicates the ranking of that step within the top 20% most risky steps for different failure modes. Green text denotes failure modes with S ≥ 8, regardless of whether they were in top 20% most risky categories. The colored arrows show the flow of information or actual physical material between one subprocess and another. Specifically, the purple arrows show how immobilization and positioning impact on steps further downstream; the light blue arrows show the downstream flow of anatomic information, the dark green the transfer of initial images. Green circles represent a congregation of high severity steps. Red circles are drawn around those steps with a high concentration of identified hazardous steps. A red circle drawn around a green circle indicates a congregation of steps that are both hazardous and severe. QM measures in the earlier step would prevent errors from entering the later step.
FIG. 6.
FIG. 6.
(A) A portion of the fault tree for the step RTP anatomy failure involving the failure mode of >3 sigma contouring errors; this failure is in a red-edged box with its RPN (366) at its upper right corner. The black numbers are line numbers from the full FTA (Appendix E) (Ref. 141). (B) The fault tree shown in Fig. 6(A) with the inclusion of quality management.
FIG. 7.
FIG. 7.
The number of fractions that can be delivered with a given error plotted as a function of the percentage error in dose per erroneous fraction, for total allowed dose errors of 5% and 1.6% in treatment courses of 35, 10, and 5 fractions. The purple and dark blue vertical lines indicate the two interlocks discussed in the text: a weak interlock where output errors up to 40% can be delivered and a modern interlock which cuts off delivery if the output error exceeds 5%. The red horizontal line is at 2 fractions: for situations that fall below this line, the simple model calls for daily or even more frequent output checks.
FIG. 8.
FIG. 8.
Traditional failure modes and effects analysis worksheet.
FIG. 9.
FIG. 9.
Example of process maps.
FIG. 10.
FIG. 10.
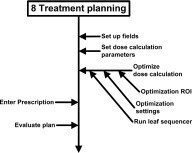
Treatment planning segment from a process tree describing IMRT process.
FIG. 11.
FIG. 11.
FMEA table.

References

    1. Klein E. E., Hanley J., Bayouth J., Yin F. F., Simon W., Dresser S., Serago C., Aguirre F., Ma L., Arjomandy B., Liu C., Sandin C., and Holmes T., “Task Group 142 report: Quality assurance of medical accelerators,” Med. Phys. 36, 4197–4212 (2009). 10.1118/1.3190392 - DOI - PubMed
    1. Kutcher G. J. et al. , “Comprehensive QA for radiation oncology: Report of AAPM Radiation Therapy Committee Task Group 40,” Med. Phys. 21, 581–618 (1994). 10.1118/1.597316 - DOI - PubMed
    1. Nath R., Anderson L. L., Luxton G., Weaver K. A., Williamson J. F., and Meigooni A. S., “Dosimetry of interstitial brachytherapy sources: Recommendations of the AAPM Radiation Therapy Committee Task Group No. 43. American Association of Physicists in Medicine,” Med. Phys. 22, 209–234 (1995). 10.1118/1.597458 - DOI - PubMed
    1. Fraass B., Doppke K., Hunt M., Kutcher G., Starkschall G., Stern R., and Van Dyke J., “American Association of Physicists in Medicine Radiation Therapy Committee Task Group 53: Quality assurance for clinical radiotherapy treatment planning,” Med. Phys. 25, 1773–1829 (1998). 10.1118/1.598373 - DOI - PubMed
    1. Nath R., Anderson L. L., Meli J. A., Olch A. J., Stitt J. A., and Williamson J. F., “Code of practice for brachytherapy physics: Report of the AAPM Radiation Therapy Committee Task Group No. 56. American Association of Physicists in Medicine,” Med. Phys. 24, 1557–1598 (1997). 10.1118/1.597966 - DOI - PubMed

Publication types

MeSH terms