

Towards a wearable near infrared spectroscopic probe for monitoring concentrations of multiple chromophores in biological tissue in vivo
- PMID: 27370501
- PMCID: PMC4957669
- DOI: 10.1063/1.4954722
Towards a wearable near infrared spectroscopic probe for monitoring concentrations of multiple chromophores in biological tissue in vivo
Abstract
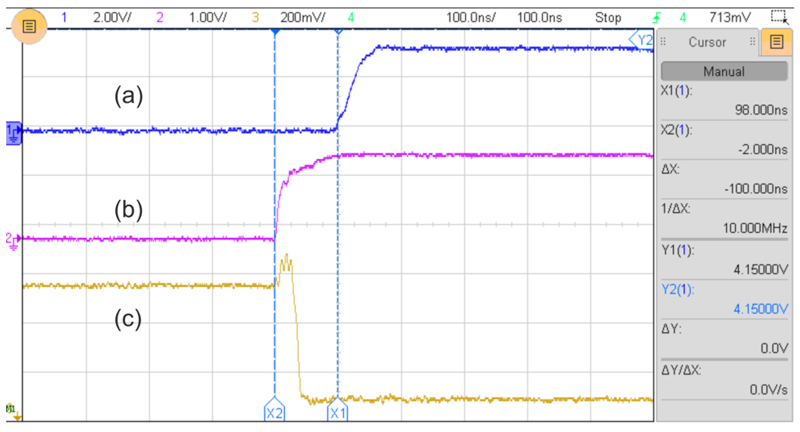
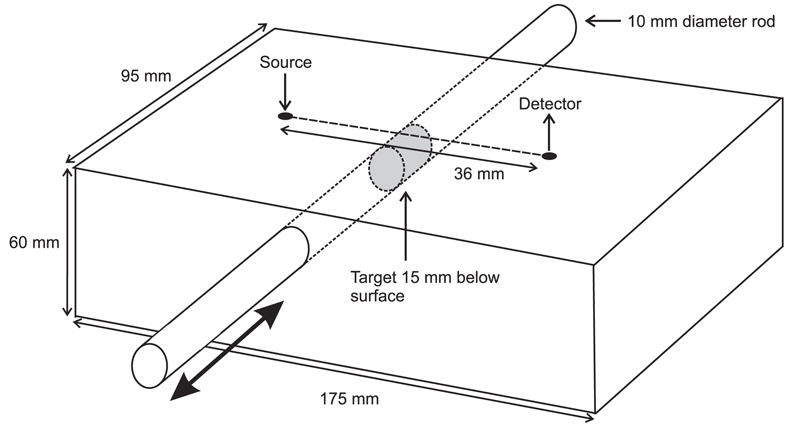
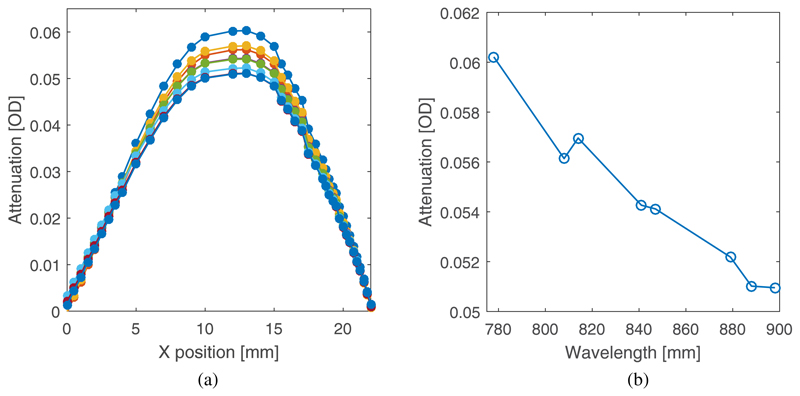
The first wearable multi-wavelength technology for functional near-infrared spectroscopy has been developed, based on a custom-built 8-wavelength light emitting diode (LED) source. A lightweight fibreless probe is designed to monitor changes in the concentrations of multiple absorbers (chromophores) in biological tissue, the most dominant of which at near-infrared wavelengths are oxyhemoglobin and deoxyhemoglobin. The use of multiple wavelengths enables signals due to the less dominant chromophores to be more easily distinguished from those due to hemoglobin and thus provides more complete and accurate information about tissue oxygenation, hemodynamics, and metabolism. The spectroscopic probe employs four photodiode detectors coupled to a four-channel charge-to-digital converter which includes a charge integration amplifier and an analogue-to-digital converter (ADC). Use of two parallel charge integrators per detector enables one to accumulate charge while the other is being read out by the ADC, thus facilitating continuous operation without dead time. The detector system has a dynamic range of about 80 dB. The customized source consists of eight LED dies attached to a 2 mm × 2 mm substrate and encapsulated in UV-cured epoxy resin. Switching between dies is performed every 20 ms, synchronized to the detector integration period to within 100 ns. The spectroscopic probe has been designed to be fully compatible with simultaneous electroencephalography measurements. Results are presented from measurements on a phantom and a functional brain activation study on an adult volunteer, and the performance of the spectroscopic probe is shown to be very similar to that of a benchtop broadband spectroscopy system. The multi-wavelength capabilities and portability of this spectroscopic probe will create significant opportunities for in vivo studies in a range of clinical and life science applications.
Figures


Similar articles
-
A Fibreless Multiwavelength NIRS System for Imaging Localised Changes in Cerebral Oxidised Cytochrome C Oxidase.Adv Exp Med Biol. 2018;1072:339-343. doi: 10.1007/978-3-319-91287-5_54. Adv Exp Med Biol. 2018. PMID: 30178368 Free PMC article.
-
Wearable near-infrared optical probe for continuous monitoring during breast cancer neoadjuvant chemotherapy infusions.J Biomed Opt. 2017 Jan 1;22(1):14001. doi: 10.1117/1.JBO.22.1.014001. J Biomed Opt. 2017. PMID: 28114449 Free PMC article.
-
Optimal wavelength combinations for near-infrared spectroscopic monitoring of changes in brain tissue hemoglobin and cytochrome c oxidase concentrations.Biomed Opt Express. 2015 Feb 23;6(3):933-47. doi: 10.1364/BOE.6.000933. eCollection 2015 Mar 1. Biomed Opt Express. 2015. PMID: 25798316 Free PMC article.
-
Quantitative In Vivo Imaging of Tissue Absorption, Scattering, and Hemoglobin Concentration in Rat Cortex Using Spatially Modulated Structured Light.In: Frostig RD, editor. In Vivo Optical Imaging of Brain Function. 2nd edition. Boca Raton (FL): CRC Press/Taylor & Francis; 2009. Chapter 12. In: Frostig RD, editor. In Vivo Optical Imaging of Brain Function. 2nd edition. Boca Raton (FL): CRC Press/Taylor & Francis; 2009. Chapter 12. PMID: 26844326 Free Books & Documents. Review.
-
Wearable, Integrated EEG-fNIRS Technologies: A Review.Sensors (Basel). 2021 Sep 12;21(18):6106. doi: 10.3390/s21186106. Sensors (Basel). 2021. PMID: 34577313 Free PMC article. Review.
Cited by
-
Non-invasive methods for measuring vascular changes in neurovascular headaches.J Cereb Blood Flow Metab. 2019 Apr;39(4):633-649. doi: 10.1177/0271678X17724138. Epub 2017 Aug 7. J Cereb Blood Flow Metab. 2019. PMID: 28782410 Free PMC article. Review.
-
ninjaNIRS: an open hardware solution for wearable whole-head high-density functional near-infrared spectroscopy.Biomed Opt Express. 2024 Sep 4;15(10):5625-5644. doi: 10.1364/BOE.531501. eCollection 2024 Oct 1. Biomed Opt Express. 2024. PMID: 39421779 Free PMC article.
-
Wearable and modular functional near-infrared spectroscopy instrument with multidistance measurements at four wavelengths.Neurophotonics. 2017 Oct;4(4):041413. doi: 10.1117/1.NPh.4.4.041413. Epub 2017 Aug 18. Neurophotonics. 2017. PMID: 28840164 Free PMC article.
-
Functional imaging of the human brain using a modular, fibre-less, high-density diffuse optical tomography system.Biomed Opt Express. 2016 Sep 27;7(10):4275-4288. doi: 10.1364/BOE.7.004275. eCollection 2016 Oct 1. Biomed Opt Express. 2016. PMID: 27867731 Free PMC article.
-
Review of recent progress toward a fiberless, whole-scalp diffuse optical tomography system.Neurophotonics. 2018 Jan;5(1):011012. doi: 10.1117/1.NPh.5.1.011012. Epub 2017 Sep 26. Neurophotonics. 2018. PMID: 28983490 Free PMC article. Review.
References
-
- Cabeza R, Nyberg L. Imaging cognition. II An empirical review of 275 PET and fMRI studies. J Cognit Neurosci. 2000;12(1):1–47. - PubMed
-
- Ghosh A, Elwell C, Smith M. Review Article: Cerebral near-infrared spectroscopy in adults: A work in progress. Anesth Analg. 2012;115(6):1373–1383. - PubMed
-
- Ferrari M, Quaresima V. A brief review on the history of human functional near-infrared spectroscopy (fNIRS) development and fields of application. Neuroimage. 2012;63:921. - PubMed
-
- Scholkmann F, Kleiser S, Metz AJ, Zimmerman R, Pavia JM, Wolf U, Wolf M. A review on continuous wave functional near-infrared spectroscopy and imaging instrumentation and methodology. Neuroimage. 2014;85:6–27. - PubMed
MeSH terms
Grants and funding
LinkOut - more resources
Full Text Sources
Other Literature Sources
Miscellaneous