. 2016 Aug 15;197(4):1477-88.
doi: 10.4049/jimmunol.1600589. Epub 2016 Jul 1.

Molecular Profile of Tumor-Specific CD8+ T Cell Hypofunction in a Transplantable Murine Cancer Model

Affiliations

Molecular Profile of Tumor-Specific CD8+ T Cell Hypofunction in a Transplantable Murine Cancer Model

Katherine A Waugh et al. J Immunol. .

Abstract

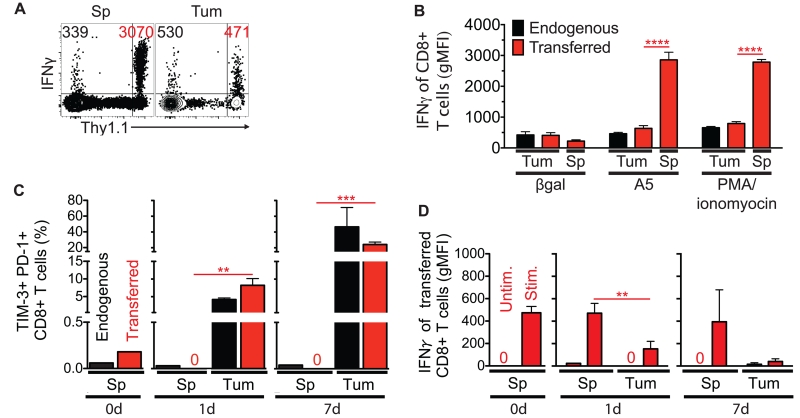
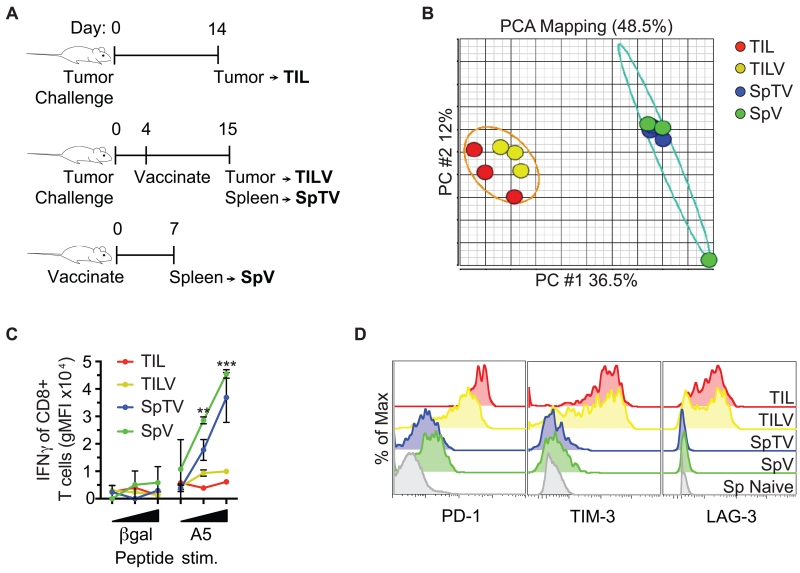
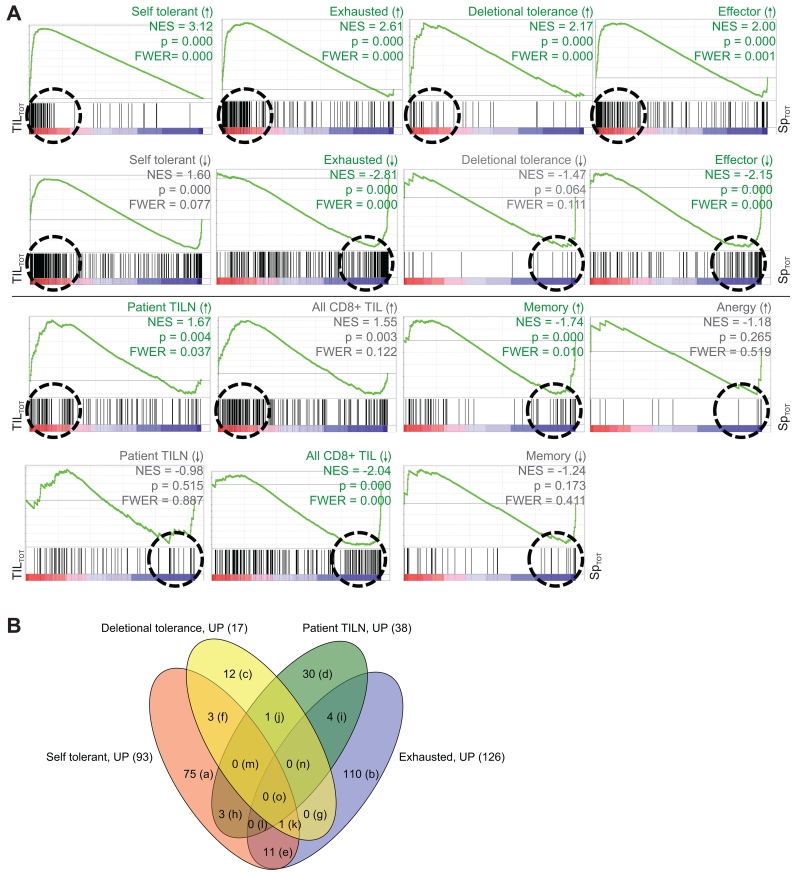
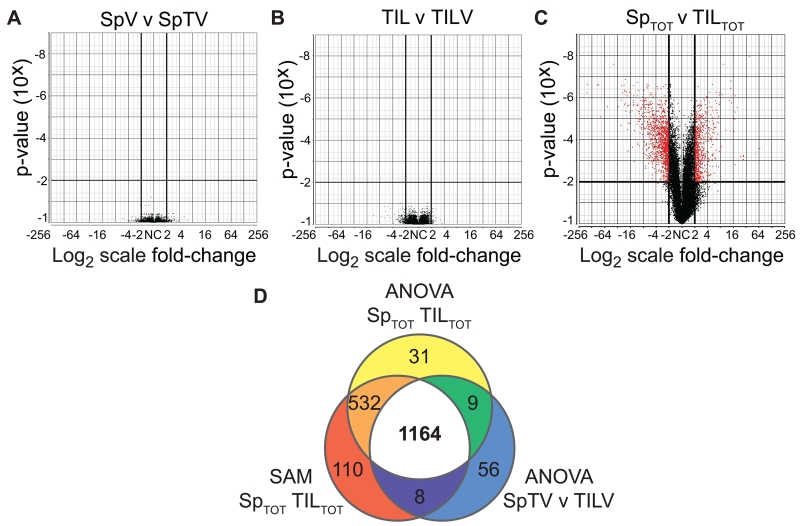
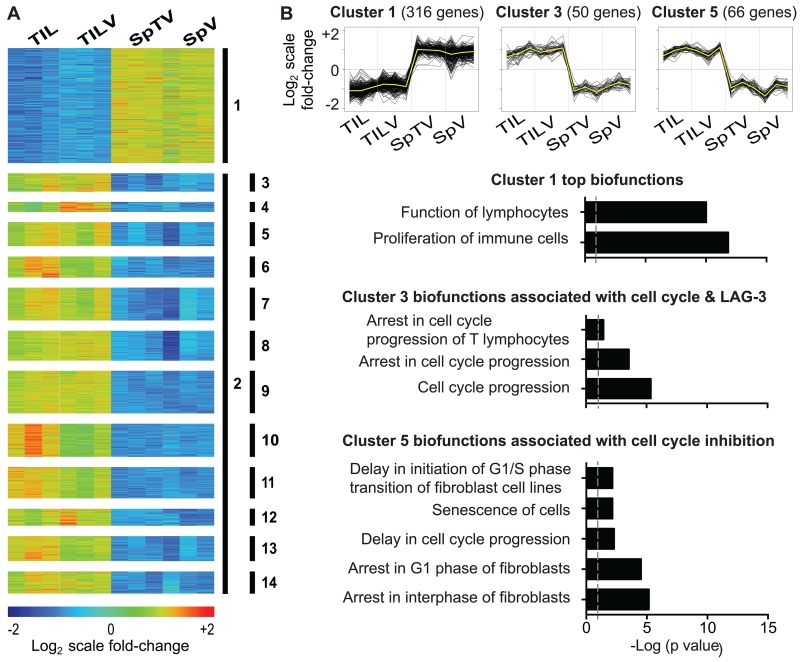
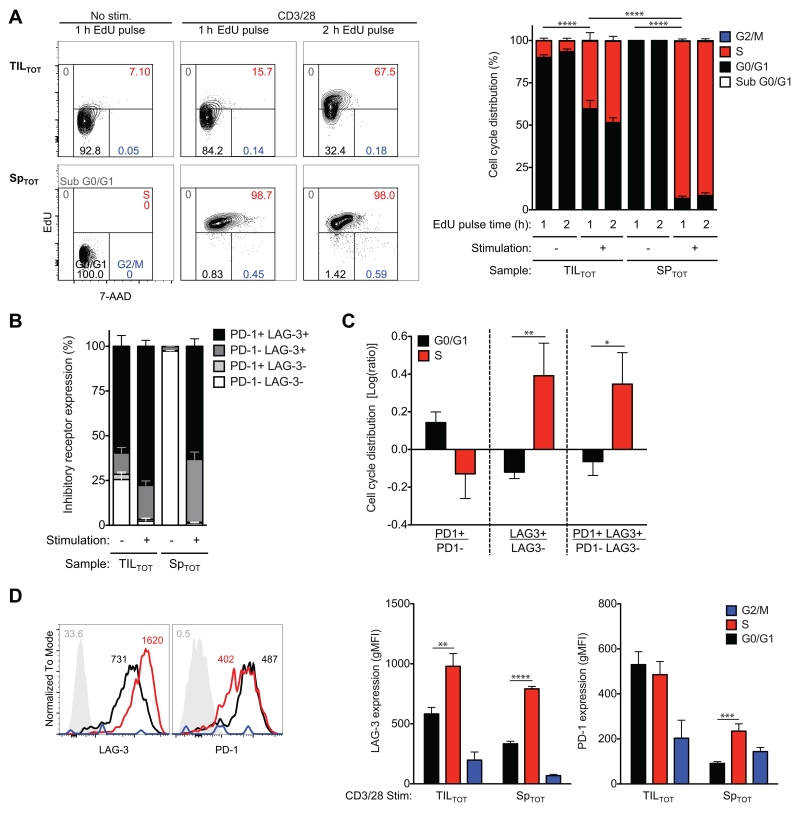
Mechanisms of self-tolerance often result in CD8(+) tumor-infiltrating lymphocytes (TIL) with a hypofunctional phenotype incapable of tumor clearance. Using a transplantable colon carcinoma model, we found that CD8(+) T cells became tolerized in <24 h in an established tumor environment. To define the collective impact of pathways suppressing TIL function, we compared genome-wide mRNA expression of tumor-specific CD8(+) T cells from the tumor and periphery. Notably, gene expression induced during TIL hypofunction more closely resembled self-tolerance than viral exhaustion. Differential gene expression was refined to identify a core set of genes that defined hypofunctional TIL; these data comprise the first molecular profile of tumor-specific TIL that are naturally responding and represent a polyclonal repertoire. The molecular profile of TIL was further dissected to determine the extent of overlap and distinction between pathways that collectively restrict T cell functions. As suggested by the molecular profile of TIL, protein expression of inhibitory receptor LAG-3 was differentially regulated throughout prolonged late-G1/early-S phase of the cell cycle. Our data may accelerate efficient identification of combination therapies to boost anti-tumor function of TIL specifically against tumor cells.


Figures

FIGURE 1
FIGURE 1
Effector CD8+ T cells become hypofunctional within 24 h in a CT26 tumor environment. Transferred live CD8+ T cells, known to protect against tumor challenge, were adoptively transferred into a tumor-bearing host and monitored at the indicated time points from the tumor (Tum) and spleen (Sp). (A) One day after adoptive transfer into a tumor-bearing host, transferred (Thy1.1+) CD8+ T cells from the Tum and Sp were assayed for IFNγ protein in response to A5 peptide (10 μg/ml) stimulation ex vivo. Geometric mean fluorescent intensities (gMFIs) in representative dot plots from IFNγ+ endogenous (upper left quadrant, black) and transferred (upper right quadrant, red) live CD8+ T cells are shown. (B) Expression level of IFNγ in transferred CD8+ T cells from the Tum and Sp was measured in response to A5 peptide (10 μg/ml) and PMA/ionomyocin stimulation ex vivo one day after adoptive transfer into a tumor-bearing host. βgal (10 μg/ml) is an H-2Ld binding irrelevant peptide . (C) Co-expression of inhibitory receptors was monitored over time on transferred CD8+ T cells from the Tum and Sp. “0d” represents immediately before transfer, and a frequency of “0” designates no dual PD-1+/TIM-3+ cells of interest. (D) Transferred CD8+ T cells from the Tum and Sp were monitored over time for IFNγ protein production following ex vivo PMA/ionomyocin stimulation. A gMFI of “0” designates no IFNγ+ among cells of interest. Data represent at least 2 independent experiments, n=2-3 biological replicates per group, and error bars=standard deviation of the mean (SD).
FIGURE 2
FIGURE 2
Genome-wide mRNA expression of tumor-specific CD8+ T cells segregates into two functionally distinct clusters. (A) Schematic of the origin of tumor antigen-specific T cells is shown. AH1-specific CD8+ T cells were tetramer-sorted from CT26 tumors of mice that had (TILV) or had not (TIL) been vaccinated, and spleens of vaccinated mice that either harbored (SpTV) or did not harbor tumors (SpV). (B) Messenger RNA from the groups described in A was interrogated by microarray. Principal component analysis (PCA) divided genome-wide mRNA expression of the indicated cell populations into two distinct clusters, tumor-specific CD8+ T cells from the spleen or the tumor. Five to ten mice were pooled per group, and each group was repeated 3 times. (C) AH1-specific CD8+ T cells described in A were stimulated ex vivo with increasing concentrations of the indicated peptide and assayed for IFNγ production. (D) AH1-specific CD8+ T cells described in A were analyzed for inhibitory receptor expression. The grey histogram represents naive CD8+ T cells from a spleen as a negative control for inhibitory receptor expression. C and D are representative data of at least 2 independent experiments, n=1-4 biological replicates, and error bars=SD.
FIGURE 3
FIGURE 3
Genome-wide mRNA expression of tumor-specific TIL from the CT26 tumor is similar to transcription profiles of other hypofunctional CD8+ T cells; similarities are driven by distinct gene expression. Genome-wide mRNA expression of TASPR T cells, acquired as described in Figure 2A, was simultaneously compared to other published CD8+ T cell transcriptional profiles for similarities by gene set enrichment analysis (GSEA) (30). (A) Plots show enrichment of genes associated with the indicated T cell profile, or “gene set.” Vertical black lines show where gene sets match genes expressed by TASPR T cells from the tumor (red, TILTOT = TIL and TILV) and spleen (blue, SpTOT = SpTV and SpV). The Normalized Enrichment Scores (NES) reflect the degree to which a gene set is overrepresented at the extremes of the entire ranked list of gene expression differences between TASPR T cells from the tumor and spleen; an NES value farther from 0 indicates greater enrichment of the indicated profile genes among TASPR T cells from the tumor (positive NES) or spleen (negative NES). The green line is a visual representation of gene set enrichment along the ranked list. The Leading Edge, roughly shown by a dashed circle, includes the core genes from a gene set that contribute most to the deviation of an NES from 0. Profile gene sets were determined to significantly cluster among genes highly expressed by TASPR T cells from the tumor or spleen when p-value ≤ 0.001 (30) and familywise error rate ≤ 0.05 (FWER, which suggests the probability of type 1 errors), and are delineated by green rather than grey labels. (B) The majority of Leading Edge genes differ between the hypofunctional CD8+ T cell profiles. These core genes drive the NES away from 0 in the Leading Edge (circled in A) and are compared in the Venn diagram and Supplemental Table 2.
FIGURE 4
FIGURE 4
Molecular profile of tumor-specific TIL that are naturally-responding and polyclonal. Genome-wide mRNA expression of TASPR T cells acquired in Figure 2A (TILTOT=TIL and TILV and SpTOT=SpTV and SpV) were compared for differential gene expression. (A-C) Volcano plots comparing the indicated groups illustrate significant 2-fold differential gene-expression by one-way ANOVA in red. (D) Differentially-expressed genes were narrowed by ANOVA, as in C, and by SAM. Genes common to all three groups were designated the “molecular profile” of TASPR TIL.
FIGURE 5
FIGURE 5
Molecular profile of tumor-specific TIL from the CT26 tumor highlights transcriptional regulation of cell cycle inhibition. The molecular profile of TASPR T cells acquired in Figure 2A was analyzed in clusters for enrichment of biological pathways. (A) K-means clustering (KMC) divided differentially-expressed genes into 13 clusters for focused pathway analyses. Heat map shows log2-transformed expression intensities mean-centered at the probe level. (B) Pathway analysis of gene products from Clusters 1, 3, and 5 revealed corresponding biofunctions enriched in TASPR T cells from the spleen and tumor. Grey dashed lines represent p value = 0.05.
FIGURE 6
FIGURE 6
Slowed cell cycle progression of CD8+ T cells in the CT26 tumor corresponds to a novel pattern of inhibitory receptor expression predicted by the molecular profile of TIL. Total CD8+ T cells from CT26 tumors (TILTOT) and spleens (SpTOT) from timelines shown in Figure 2A were untreated or treated with antibodies to CD3 and CD28 for 48 h before a 1 h (or indicated time) pulse with the thymidine analogue EdU. Flow cytometric analyses identified cell cycle phase and inhibitory receptor expression of live CD8+ T cells. (A) Cell cycle phase was resolved by staining for EdU and by the DNA dye 7-AAD. Frequencies are shown in sub G0/G1 (grey), G0/G1 (black), S (red), and G2/M (blue) phase. (B) Inhibitory receptor expression (PD-1 and LAG-3) was determined in the presence and absence of stimulation. (C) Inhibitory receptor expression on TILTOT during G0/G1 and S phase was determined. (D) Representative histograms (left) of naive CD8+ T cells from spleen (grey, negative control) and stimulated TILTOT cells [G0/G1 (black), S (red), and G2/M (blue) phase] are shown. Numbers indicate the gMFI. At this time point (48 h), frequency of synchronized T cells in G2/M phase (blue) was too small to confidently determine inhibitory receptor expression. All data (right) represent three independent experiments, n=3-10 biological replicates per group, error bars=SEM.

References

    1. Galon J, Costes A, Sanchez-Cabo F, Kirilovsky A, Mlecnik B, Lagorce-Pages C, Tosolini M, Camus M, Berger A, Wind P, Zinzindohoue F, Bruneval P, Cugnenc PH, Trajanoski Z, Fridman WH, Pages F. Type, density, and location of immune cells within human colorectal tumors predict clinical outcome. Science. 2006;313:1960–1964. - PubMed
    1. Fridman WH, Pages F, Sautes-Fridman C, Galon J. The immune contexture in human tumours: impact on clinical outcome. Nat Rev Cancer. 2012;12:298–306. - PubMed
    1. Schietinger A, Greenberg PD. Tolerance and exhaustion: defining mechanisms of T cell dysfunction. Trends Immunol. 2014;35:51–60. - PMC - PubMed
    1. Dunn GP, Old LJ, Schreiber RD. The three Es of cancer immunoediting. Annu Rev Immunol. 2004;22:329–360. - PubMed
    1. Baitsch L, Fuertes-Marraco SA, Legat A, Meyer C, Speiser DE. The three main stumbling blocks for anticancer T cells. Trends Immunol. 2012;33:364–372. - PubMed

Publication types