. 2016 Sep 8;6(9):3003-14.
doi: 10.1534/g3.116.032342.

Scan-o-matic: High-Resolution Microbial Phenomics at a Massive Scale

Affiliations

Scan-o-matic: High-Resolution Microbial Phenomics at a Massive Scale

Martin Zackrisson et al. G3 (Bethesda). .

Abstract

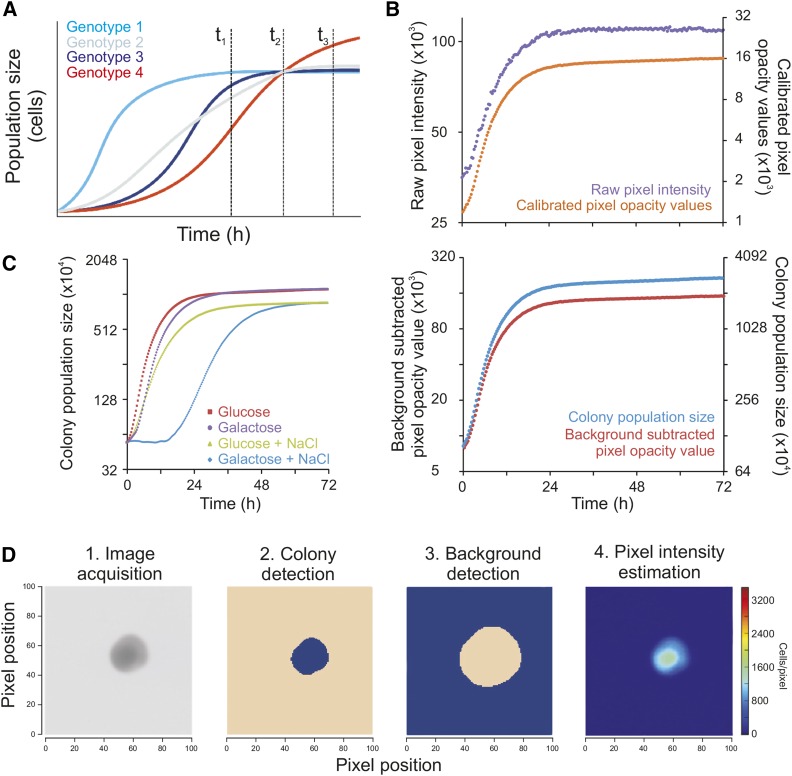
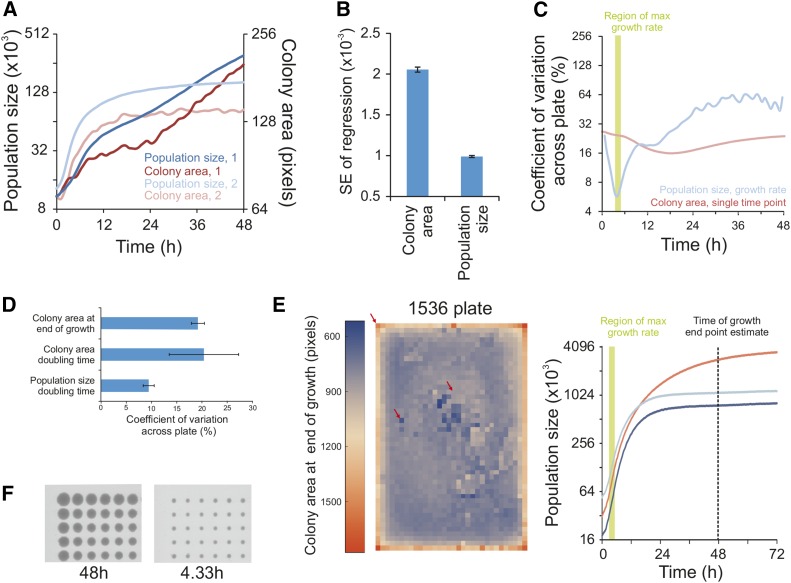
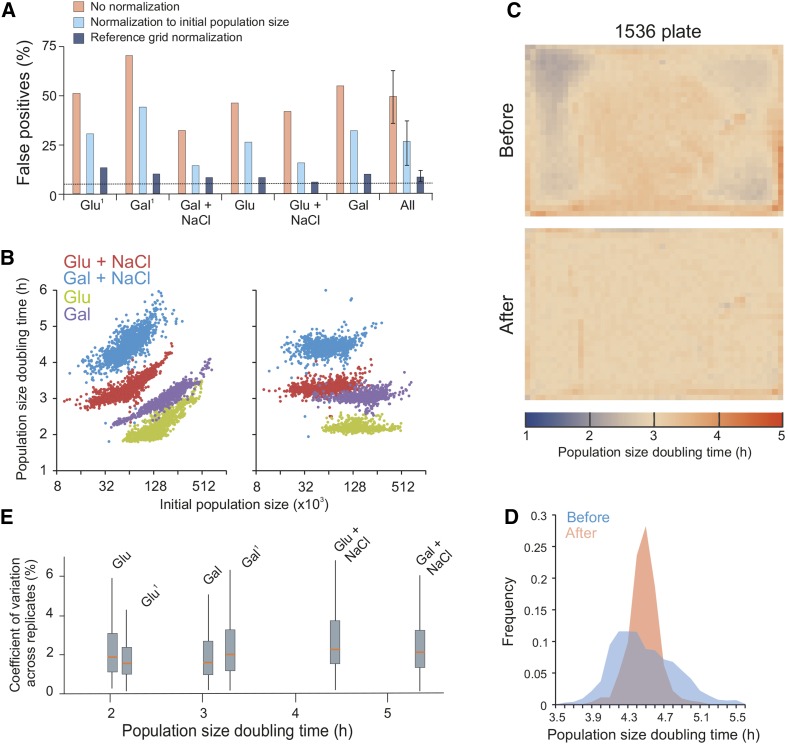
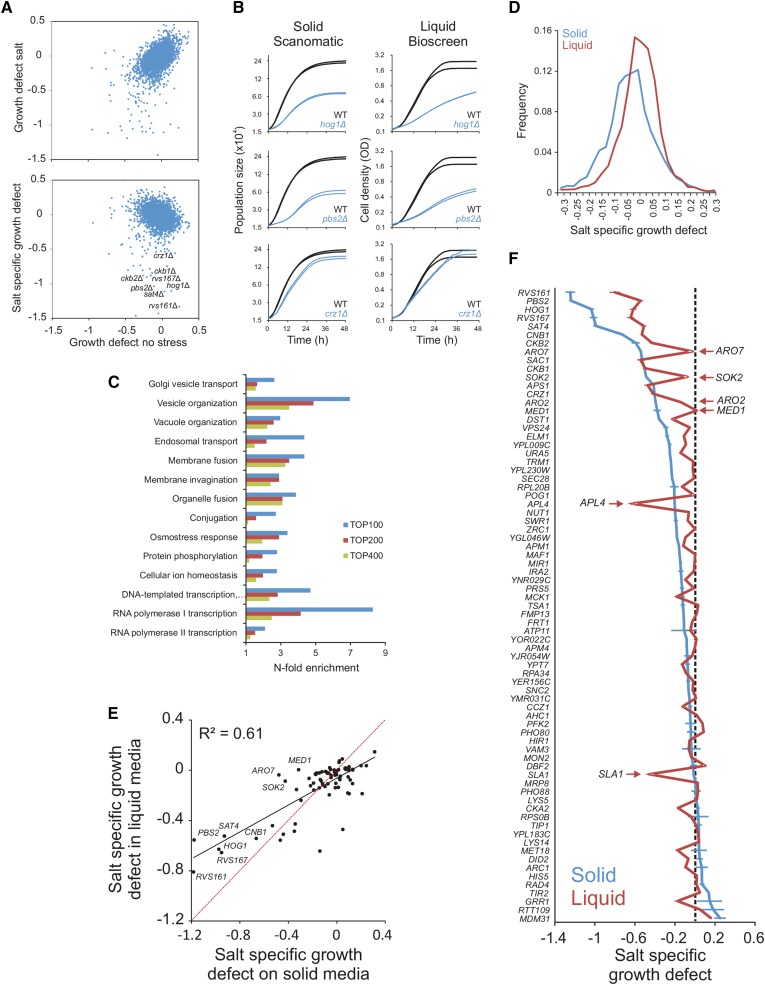
The capacity to map traits over large cohorts of individuals-phenomics-lags far behind the explosive development in genomics. For microbes, the estimation of growth is the key phenotype because of its link to fitness. We introduce an automated microbial phenomics framework that delivers accurate, precise, and highly resolved growth phenotypes at an unprecedented scale. Advancements were achieved through the introduction of transmissive scanning hardware and software technology, frequent acquisition of exact colony population size measurements, extraction of population growth rates from growth curves, and removal of spatial bias by reference-surface normalization. Our prototype arrangement automatically records and analyzes close to 100,000 growth curves in parallel. We demonstrate the power of the approach by extending and nuancing the known salt-defense biology in baker's yeast. The introduced framework represents a major advance in microbial phenomics by providing high-quality data for extensive cohorts of individuals and generating well-populated and standardized phenomics databases.

Keywords: genetics; high throughput; microbiology; phenomics; screening.


Figures

Figure 1
Figure 1
A novel framework for high-resolution microbial phenomics. (A) Simulated growth data to exemplify the problem with endpoint analysis given different growth paths. Single time point measures at different stages of growth (vertical broken lines) can provide wildly diverging views of the relative growth performance of strains, alternatively scoring all genotypes as identical (t2), genotype 1 as superior (t1), or genotype 4 as superior (t3). This illustrates the conceptual importance of having access to highly resolved growth curve data. (B) Illustration of the conversion from raw pixel intensities to total population size in cell numbers for a randomly chosen example colony growing on 2% glucose in basal medium. Upper graph: Colony growth curve based on raw pixel intensities (left axis; lilac) and calibrated pixel opacity values (right axis; orange). Lower graph: Colony growth curve based on background subtracted pixel opacity values (left y-axis; red) and cell counts/population size (right y-axis; blue). (C) Colony population growth curves obtained by cultivating genetically identical WT (BY4743) colonies in four environmental contexts (conditions indicated) after having shared identical preculture media and measuring colony population size in 20 min intervals. y-axis is on log2 scale. (D) Colony population size is extracted from raw images in a multi-step procedure, proceeding from 1. raw image, to 2. probable colony (blob; blue) detection and segmentation, 3. local background definition (blue) with a safety margin to colony, and 4. estimation of cells as pixel intensity as compared to background. Color intensity = 0 (dark blue), 1500 (turquoise) cells per pixel. NaCl, sodium chloride; WT, wild type.
Figure 2
Figure 2
Dramatically enhanced measurement precision in microbial phenomics. (A and B) Comparing random noise in growth curves based on either colony area or colony population size. (A) Growth curves of two colonies, labeled 1 and 2, based on either colony area or population size (cell counts). y-axes are on log2 scale. (B) Estimating growth curve noise in the critical section of the curve when growth is maximal. Noise was measured as the standard error of the regression corresponding to the highest slope. Mean of 1536 genetically identical WT growth curves in an unstressed environment is shown. Error bars = SEM. (C and D) The sum of random noise and systematic bias over a plate, measured as the coefficient of variation across 1536 genetically identical WT colonies. (C) Precision as a function of time, for colony area size and colony population size growth rate. A single plate of unstressed populations is depicted. y-axis is on log2 scale. Green area shows the time period in which 96% (within 2σ of the mean time point: 4.15 hr) of experiments have their maximum growth rate. (D) Precision for single measure of colony area at end of growth (48 hr), colony area-based growth rate, and colony population size-based growth rate. The mean of four plates with different conditions (2% glucose and 2% galactose, with and without 0.85 M NaCl) is shown. Error bars = SEM. (E) Left panel: visual representation of the edge effect over a plate for colony area at the end of growth (48 hr). Each square corresponds to one of 1536 genetically identical WT colonies grown in 2% glucose, basal medium. Color intensity shows colony area, dark blue = 500 and red = 1800 pixels. Red arrows indicate the three colonies highlighted in the right panel. Right panel: population size growth curves for colonies indicated by red arrows in the left panel. Curve color matches the color of the squares in the left panel. Broken line: 48 hr time point that is typically used for endpoint growth measures. Green area: time region in which 96% (within 2σ of the mean time point, 4.15 hr) of the curves have their maximum growth rate. (F) Raw image of a corner section of a 1536 plate with genetically identical (WT) colonies growing in 2% glucose, basal medium, at 48 hr and at the time of maximal growth rate (4.33 hr). NaCl, sodium chloride; WT, wild type.
Figure 3
Figure 3
Comprehensive removal of spatial bias in microbial phenomics. (A) Fraction of false positives due to spatial bias within plates with genetically identical colonies (WT). Each plate corresponds to one distinct environmental challenge: 2% glucose or galactose, with or without 0.85 M NaCl. Superscript 1 = glucose or galactose plates stored (cold, dark, and enclosed in plastic) for 1 mo before use. On each plate, population size doubling times of immediately adjacent colonies (excluding every fourth position that was used as a control position) were statistically compared to those of nonadjacent colonies using a one-sample Student’s t-test (H0 = 0 difference, α = 0.05). Assuming all variation to be random, i.e., no spatial bias, the random expectation is 5% false positives (broken line) at this significance cut-off. Any systematic excess of false positives corresponds to spatial bias. Pink bars = before normalization, light blue bars = after normalization to initial population size, dark blue bars = after reference grid normalization. “All” indicates the mean of false positives over all six plates with error bars = SEM. (B) Population size doubling time as a function of initial population size. Left panel = before normalization, right panel = after reference grid normalization. All individual estimates over four of the six genetically homogeneous 1536 plates with different environmental challenges (2% glucose and 2% galactose, with and without 0.85 M NaCl) are shown. (C) Spatial bias is removed by reference grid normalization. Genetically identical reference colonies are pinned into every fourth colony position (lower right position in every tetrad of positions), creating a matrix of 384 control colonies on which a normalization surface of population doubling times is based. The local normalization surface is subtracted from each observation. Upper panel: distribution of population size doubling times of 1536 genetically identical colonies across a plate, before normalization. Each square corresponds to a colony position. Color indicates population size doubling time. Lower panel: as upper panel, but color represents population size doubling times after reference grid normalization. See also Figure S10. (D) Frequency distribution of population size doubling times, before and after reference grid normalization, in a sample plate (blue experiments in B, 2% galactose + 0.85 M NaCl. (E) Box plot showing variation in population doubling time estimates (y-axis, CV between adjacent colonies) after normalization within each of the six genetically identical (as in A) but environmentally distinct experiments, as a function of plate mean population doubling times (x-axis). Red line = median CV for all groups of adjacent colonies on plate, box = inter quartile range (mid 50%) of CVs, whiskers = complete range of CVs. CV, coefficient of variation; Gal, galactose; Glu, glucose; NaCl, sodium chloride; WT, wild type.
Figure 4
Figure 4
Recapitulating and extending the known salt biology with Scan-o-matic. The haploid MATα yeast deletion collection (BY4742) was cultivated in 2% glucose, with and without 0.85 M NaCl. Log2 population doubling times relative the control surface of WT controls were extracted. Negative values represent growth defects. (A) Upper panel: comparison of relative population size doubling times of the yeast deletion collection in presence and absence of NaCl. Lower panel: colony population doubling times in NaCl were normalized to corresponding measures in absence of NaCl, estimating NaCl-specific growth effects. These were plotted as a function of relative population doubling times in the absence of NaCl. Little correlation remains. (B) Growth dynamics of three sample deletion strains (n = 2) with NaCl-specific growth defects, in Scan-o-matic and during liquid microcultivation. (C) Functions enriched (Fisher’s exact test, false discovery rate, q < 0.05) among the top 100, 200, and 400 most salt sensitive deletion strains in Scan-o-matic. Cut-offs approximately correspond to relative growth defects larger than −0.27, −020, and −0.15. (D) Frequency distributions of salt-specific deletion strain growth effects, obtained by solid substrate cultivation in Scan-o-matic and by liquid microcultivation in a Bioscreen C (Warringer and Blomberg 2003). (E and F) A subset of 70 deletion strains, half of which were chosen to represent the most salt sensitive deletion strains detected in the global screen and half of which were chosen randomly, were recultivated in the absence and presence of 0.85 M NaCl at high replication, using Scan-o-matic (n = 24) and liquid (n = 6) microcultivation, respectively. Recultivations were performed in parallel (the same precultures) and in identical conditions, removing all conceivable systematic variation beside cultivation method. (E) Salt-specific growth defects in Scan-o-matic and liquid microcultivation regimes. Regression (black, Pearson R2 is indicated) and 1:1 lines (red) are shown. (F) Comparison of growth defects in mutants between agar and liquid growth. Deletion strains were ranked based on salt-specific growth effects during solid substrate cultivation and salt-specific growth effects were plotted for both conditions (solid and liquid). Error bars = SEM. NaCl, sodium chloride; WT, wild type.

References

    1. Balguerie A., Bagnat M., Bonneu M., Aigle M., Breton A. M., 2002. Rvs161p and Sphingolipids Are Required for Actin Repolarization following Salt Stress. Eukaryot. Cell 1(6): 1021–1031. - PMC - PubMed
    1. Banks A. P., Lawless C., Lydall D. A., 2012. A quantitative fitness analysis workflow. J. Vis. Exp. 66 Available at: http://www.jove.com/video/4018/a-quantitative-fitness-analysis-workflow. - PMC - PubMed
    1. Baryshnikova A., Costanzo M., Kim Y., Ding H., Koh J., et al. , 2010. Quantitative analysis of fitness and genetic interactions in yeast on a genome scale. Nat. Methods 7(12): 1017–1024. - PMC - PubMed
    1. Bean G. J., Jaeger P. A., Bahr S., Ideker T., 2014. Development of ultra-high-density screening tools for microbial “omics”. PLoS One 9(1): e85177. - PMC - PubMed
    1. Blomberg A., 2011. Measuring growth rate in high-throughput growth phenotyping. Curr. Opin. Biotechnol. 22(1): 94–102. - PubMed

LinkOut - more resources