Review
. 2016 Apr;39(2):107-20.
doi: 10.1016/j.bj.2016.04.003. Epub 2016 Jun 20.

Clinical applications of spectral domain optical coherence tomography in retinal diseases

Affiliations
Review

Clinical applications of spectral domain optical coherence tomography in retinal diseases

R K Murthy et al. Biomed J. 2016 Apr.

Abstract

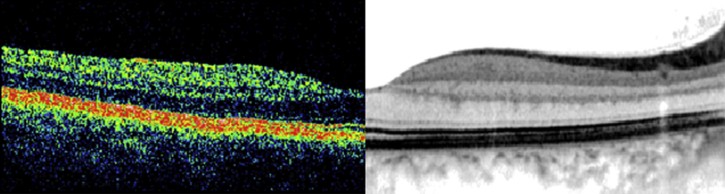
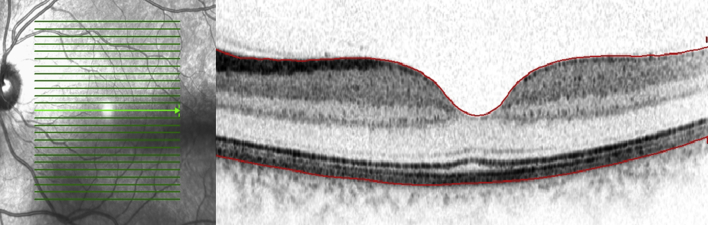
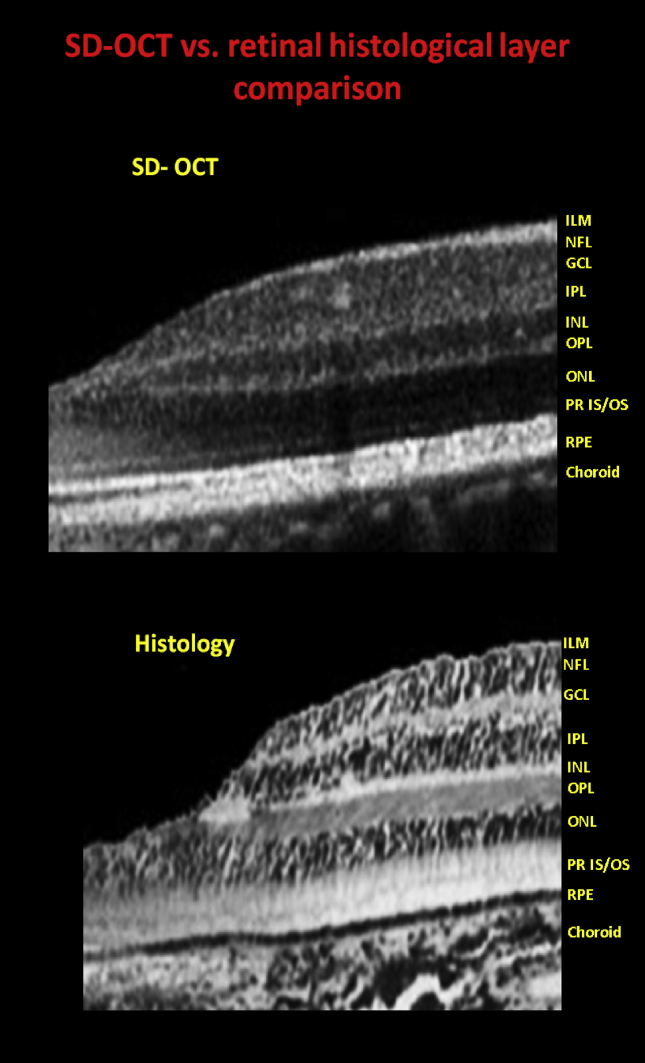
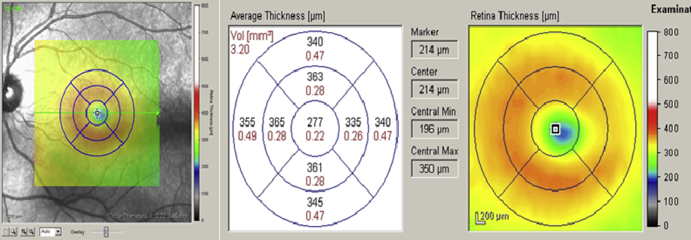
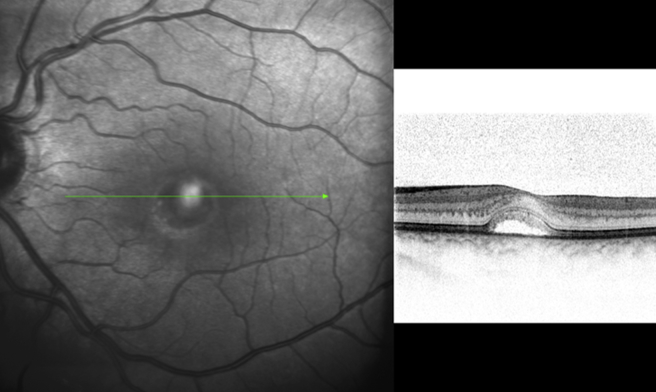
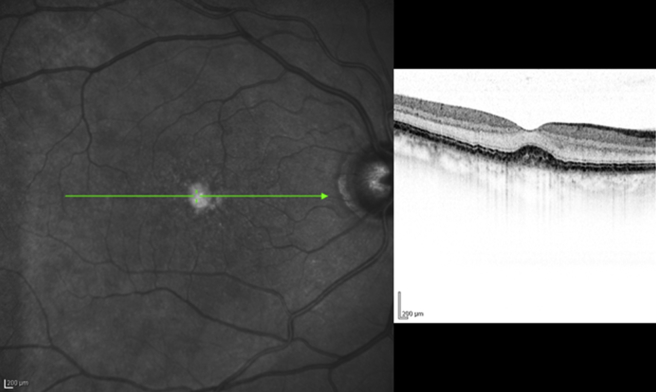
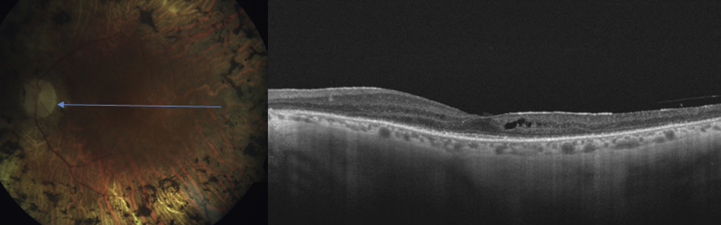
Optical coherence tomography (OCT) was introduced about two decades ago and has revolutionized ophthalmic practice in recent years. It is a noninvasive noncontact imaging modality that provides a high-resolution cross-sectional image of the cornea, retina, choroid and optic nerve head, analogous to that of the histological section. Advances in OCT technology in signal detection technique from time-domain (TD) to spectral-domain (SD) detection have given us the potential to study various retinal layers more precisely and in less time. SD-OCT better delineates structural changes and fine lesions in the individual retinal layers. Thus, we have gained substantial information about the pathologic and structural changes in ocular conditions with primary or secondary retinal involvement. This review we discuss the clinical application of currently available SD-OCT in various retinal pathologies. Furthermore, highlights the benefits of SD-OCT over TD. With the introduction of enhanced depth imaging and swept - source OCT visualization of the choroid and choriocapillaris has become possible. Therefore, OCT has become an indispensable ancillary test in the diagnosis and management of diseases involving the retina and/or the choroid. As OCT technology continues to develop further it will provide new insights into the retinal and choroidal structure and the pathogenesis of posterior segment of the eye.

Keywords: Macula; Optical coherence tomography; Retinal disorders; Spectral-domain optical coherence tomography.


Figures

Fig. 1
Fig. 1
Retinal cross-sectional image from the same subject on time-domain Stratus optical coherence tomography (left) and spectral-domain Spectralis optical coherence tomography (right).
Fig. 2
Fig. 2
Cross-sectional Spectralis optical coherence tomography image of a normal subject revealing all the retinal layers. The red lines indicate the demarcation of the inner limiting layer (top) and the basement membrane of RPE-Bruch's membrane complex (bottom).
Fig. 3
Fig. 3
Cross-sectional foveal image of a normal subject on Spectralis optical coherence tomography with delineation of all the layers of the retina (top). Comparative histological section of the fovea of a normal human eye (bottom).
Fig. 4
Fig. 4
Spectralis optical coherence tomography showing of the left eye of a normal subject with macular thickness map overlay on the infrared image (left), retinal thickness and volume date for the nine ETDRS subfields (middle) and color map (right).
Fig. 5
Fig. 5
Cross-sectional line scan image on Spectralis optical coherence tomography showing cystic inner retinal swelling in patient with diabetic macular edema.
Fig. 6
Fig. 6
(A) Fundus photo and corresponding infrared image and cross-sectional line scan image on Spectralis optical coherence tomography of a patient with early age-related macular degeneration changes revealing drusen. (B) Cross-sectional Spectralis optical coherence tomography image of left eye of a patient with geographic atrophy showing outer retinal atrophy with RPE irregularity. (C) Cross-sectional Spectralis optical coherence tomography image of left eye of a patient with exudative age-related macular degeneration revealing choroidal neovascularization with overlying retinal edema and subretinal fluid.
Fig. 7
Fig. 7
(A) Spectralis angiography with corresponding cross-sectional optical coherence tomography image of a patient with central retinal vein occlusion showing cystoid macular edema with cysts in outer plexiform and inner nuclear layer. (B) Spectralis optical coherence tomography showing cystoid macular edema in a patient with central retinal vein occlusion revealing inner retinal edema with stretched out Muller cell.
Fig. 8
Fig. 8
Spectralis optical coherence tomography image of a patient with central serous retinopathy. Note the foveal layers are intact with minimal disorganization.
Fig. 9
Fig. 9
Spectralis optical coherence tomography revealing partially detached posterior hyaloid with attachment to the fovea leading to traction and cystic changes.
Fig. 10
Fig. 10
(A) Spectralis optical coherence tomography cross-sectional image of a patient with inner lamellar macular hole. There is a tractional component with an epiretinal membrane seen nasally. (B) Spectralis optical coherence tomography cross-sectional image of a full-thickness chronic macular hole. There are cystic changes in the retina with elevation of the edges of the hole by subretinal fluid.
Fig. 11
Fig. 11
Spectralis optical coherence tomography cross-sectional image of choroidal hemangioma revealing the choroidal mass with overlying serous retinal detachment of the macula.
Fig. 12
Fig. 12
Spectralis optical coherence tomography of a patient with advanced Stargardt's disease revealing foveal atrophy with surrounding flecks.
Fig. 13
Fig. 13
Spectralis optical coherence tomography of a patient with Best disease showing buildup of lipofuscin, between the outer retina and the retinal pigment epithelium.
Fig. 14
Fig. 14
Spectralis optical coherence tomography of a patient with adultonset foveo-macular vitelliform dystrophy revealing accumulation of vitelliform material between the and neuro-sensory retina.
Fig. 15
Fig. 15
Spectralis optical coherence tomography of a patient with retinitis pigmentosa with associated cystoid macular edema and external limiting membrane.
None

References

    1. Huang D., Swanson E.A., Lin C.P., Schuman J.S., Stinson W.G., Chang W. Optical coherence tomography. Science. 1991;254:1178–1181. - PMC - PubMed
    1. Puliafito C.A., Hee M.R., Lin C.P., Reichel E., Schuman J.S., Duker J.S. Imaging of macular diseases with optical coherence tomography. Ophthalmology. 1995;102:217–229. - PubMed
    1. Hee M.R., Puliafito C.A., Wong C., Duker J.S., Reichel E., Rutledge B. Quantitative assessment of macular edema with optical coherence tomography. Arch Ophthalmol. 1995;113:1019–1029. - PubMed
    1. Schaudig U.H., Glaefke C., Scholz F., Richard G. Optical coherence tomography for retinal thickness measurement in diabetic patients without clinically significant macular edema. Ophthalmic Surg Lasers. 2000;31:182–186. - PubMed
    1. Shahidi M., Ogura Y., Blair N.P., Rusin M.M., Zeimer R. Retinal thickness analysis for quantitative assessment of diabetic macular edema. Arch Ophthalmol. 1991;109:1115–1119. - PubMed