. 2016 Jul 28;166(3):755-765.
doi: 10.1016/j.cell.2016.05.069. Epub 2016 Jun 29.

Integrated Proteogenomic Characterization of Human High-Grade Serous Ovarian Cancer

Collaborators, Affiliations

Integrated Proteogenomic Characterization of Human High-Grade Serous Ovarian Cancer

Hui Zhang et al. Cell. .

Abstract

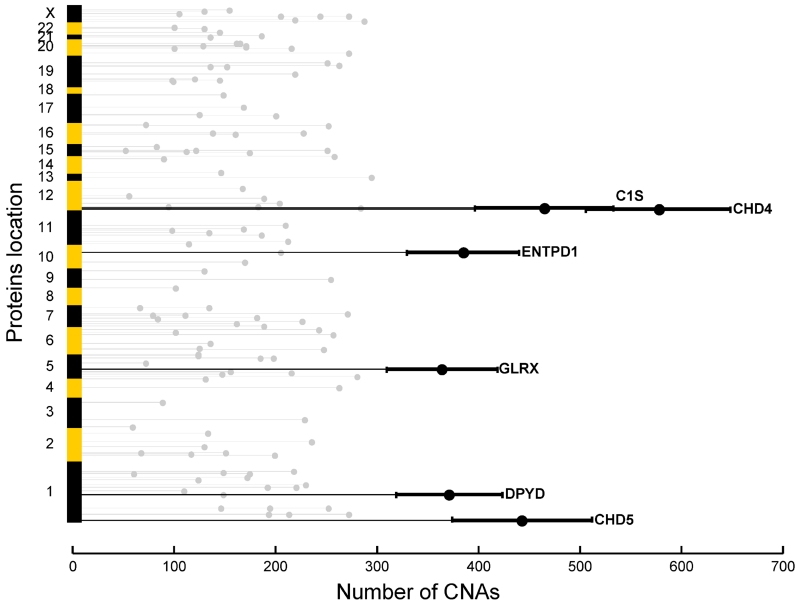
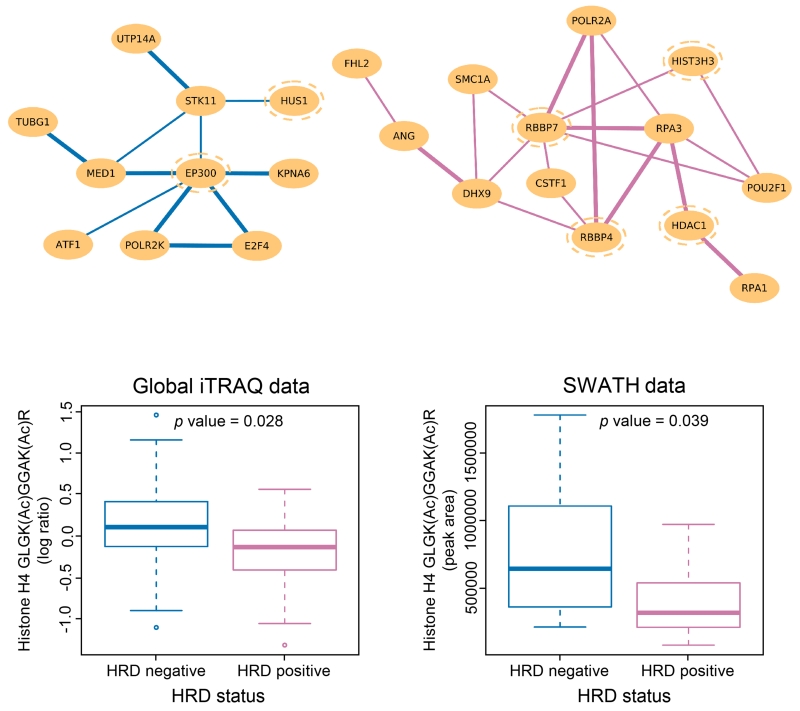
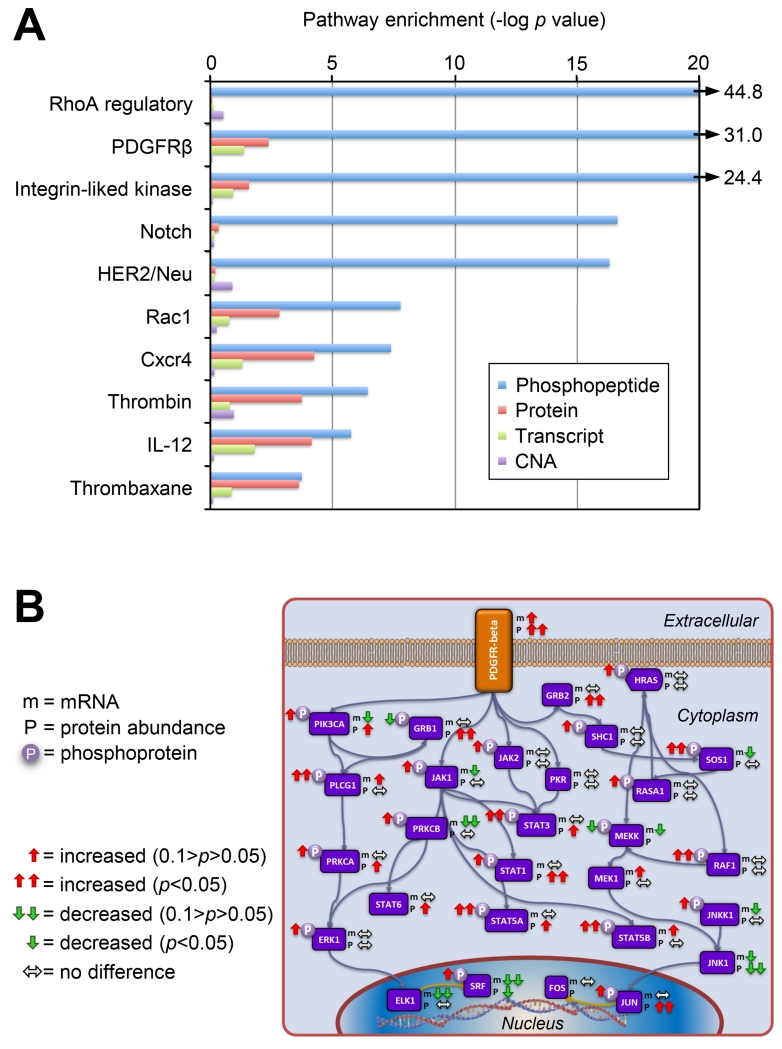
To provide a detailed analysis of the molecular components and underlying mechanisms associated with ovarian cancer, we performed a comprehensive mass-spectrometry-based proteomic characterization of 174 ovarian tumors previously analyzed by The Cancer Genome Atlas (TCGA), of which 169 were high-grade serous carcinomas (HGSCs). Integrating our proteomic measurements with the genomic data yielded a number of insights into disease, such as how different copy-number alternations influence the proteome, the proteins associated with chromosomal instability, the sets of signaling pathways that diverse genome rearrangements converge on, and the ones most associated with short overall survival. Specific protein acetylations associated with homologous recombination deficiency suggest a potential means for stratifying patients for therapy. In addition to providing a valuable resource, these findings provide a view of how the somatic genome drives the cancer proteome and associations between protein and post-translational modification levels and clinical outcomes in HGSC. VIDEO ABSTRACT.


Figures

Figure 1
Figure 1. Correlations between mRNA and protein abundance in TCGA tumors
mRNA and protein were correlated across all the samples, resulting in 90.6% positive correlations, and 79.4% were significantly correlated (Benjamini-Hochberg adjusted p value <0.01), with a mean Spearman’s correlation of 0.38 and a median value of 0.45 (top panel). Different biological pathways and processes showed significantly different levels of correlation (bottom panel). Metabolic pathways and the interferon response displayed high mRNA-protein correlation, and ribosome, mRNA splicing, oxidative phosphorylation, and complement and coagulation cascade were poorly correlated. The mean correlation is shown in parentheses followed by Benjamini-Hochberg adjusted p values calculated using a Kolmogorov–Smirnov test following the functional group names from MSIGDB. Blue bars indicate positive correlations and yellow indicates negative correlations; individual proteins (represented as bars on the x-axis) are sorted by correlation from low to high (bottom panel).
Figure 2
Figure 2. Proteomic subtypes and corresponding driving protein modules
Global proteomics abundance is shown in a heatmap with TCGA samples represented by columns ordered by protein subtype where rows represent proteins. Color of each cell indicates z-score (log2 of relative abundance scaled by proteins’ standard deviation) of the protein in that sample; red is increased and blue is decreased (relative to the pooled reference). Transcriptome-based subtypes (Verhaak et al., 2013) and the proposed proteomic subtypes are indicated in color above the heatmap. WGCNA-derived modules are delineated with the row color panel and annotated according to the pathways based on enrichment of KEGG and Reactome ontologies.
Figure 3
Figure 3. Functional impact of copy number alterations
The top panel shows the correlation of CNAs to protein abundance (right) or mRNA (left) with significant positive correlations in red and negative correlations in blue (Benjamini-Hochberg adjusted p value <0.01, Spearman’s correlation coefficient). The x-axis plots the 29,393 CNAs obtained from TCGA. The y-axis plots 3,202 proteins. Genes are ordered by chromosomal location on both the x- and y-axes. The bottom panel shows the summed number of significantly correlated proteins (or mRNA) for each individual CNA. In blue is shown the total number, in black are those genes significantly correlated as both mRNA and protein. Where blue and black lines have similar magnitude, e.g., the hotspot on chromosome 20, the CNA associations are shared between protein and mRNA. Where a strong blue line has no mirrored black line, e.g., the protein hotspot on chromosome 2, the associations with CNA are largely unique.
Figure 4
Figure 4. Kaplan-Meier plot of overall survival stratified by CNA-derived signatures
A survival plot is shown for a consensus of the four best signatures (see Figure S4A and Table S6) identified from analysis of proteins affected in trans by CNAs. Models were trained using a lasso-based Cox proportional hazards model on the samples from PNNL, and shown are the survival curves from these models applied to the non-overlapping data from the JHU analysis, with the up (red; above the median) and down (blue, below the median) signatures each representing 45 patients. A vote was taken among the four most predictive signatures, and the results of this vote are shown. Probability of death is shown on the y-axis vs. survival time in years on the x-axis. Shaded ribbons denote 95% confidence intervals.
Figure 5
Figure 5. Number of CNAs statistically explained by proteins significantly associated with CIN index
A total of 128 proteins selected for their association with CIN were arranged along the chromosomal locations of their corresponding genes (y-axis). The length of the light grey horizontal lines indicates the number of CNAs significantly correlated with the protein across all chromosomes except for the protein’s corresponding gene coding region (x-axis). The top-ranked proteins are annotated and highlighted with dark lines to show the bootstrap-estimated 95% confidence intervals.
Figure 6
Figure 6. DDN analysis and lysine-acetylation analysis between HRD and non-HRD patients
DDN analysis revealed a sub-network of proteins that displayed distinct co-expression patterns between HRD and non-HRD patients, where purple connections indicate protein correlations that exist only in HRD samples and blue connections indicate protein correlations that exist only in non-HRD patients. The links between the nodes are drawn with two different thickness indicative of whether the connections meet the significance threshold of 0.05 (light lines) or 0.01 (bold lines). Proteins with blue dotted circles are known to be involved in histone acetylation or deacetylation. Further, identification and quantitation of lysine-acetylated peptides in global proteomics data showed that acetylation level at K12 and K16 of histone H4 are significantly different between HRD and non-HRD samples, suggesting a role of histone H4 acetylation (together with HDAC1) in modulating the choice of DSB repair mechanisms.
Figure 7
Figure 7. Pathway analysis associated with patient survival
A) Pathway components were statistically analyzed using a two-sided t test between samples from patients surviving <3 years (short survival) and patients surviving >5 years (long survival) for differences in CNA, mRNA expression, protein or phosphorylation abundance. All significant pathways for mRNA and protein are shown (Benjamini-Hochberg adjusted p value <0.05) and the most significant pathways for phosphoproteomics are plotted on the x axis as the −log of the p value. Results show that phosphorylation provides additional information about the functional state of tumors. B) Simplified PDGFR-beta pathway showing differences between short and long survivor groups for protein abundance (p), transcript abundance (m), and phosphopeptide abundance (circled P).

References

    1. Barrès V, Ouellet V, Lafontaine J, Tonin PN, Provencher DM, Mes-Masson AM. An essential role for Ran GTPase in epithelial ovarian cancer cell survival. Mol. Cancer. 2010;9:272. - PMC - PubMed
    1. Cai RL, Yan-Neale Y, Cueto MA, Xu H, Cohen D. HDAC1, a histone deacetylase, forms a complex with Hus1 and Rad9, two G2/M checkpoint Rad proteins. J. Biol. Chem. 2000;275:27909–27916. - PubMed
    1. Collins BC, Gillet LC, Rosenberger G, Rost HL, Vichalkovski A, Gstaiger M, Aebersold R. Quantifying protein interaction dynamics by SWATH mass spectrometry: application to the 14-3-3 system. Nat. Methods. 2013;10:1246–1253. - PubMed
    1. Cope L, Wu RC, Shih Ie M, Wang TL. High level of chromosomal aberration in ovarian cancer genome correlates with poor clinical outcome. Gynecol. Oncol. 2013;128:500–505. - PMC - PubMed
    1. Creighton CJ, Hernandez-Herrera A, Jacobsen A, Levine DA, Mankoo P, Schultz N, Du Y, Zhang Y, Larsson E, Sheridan R, et al. Integrated analyses of microRNAs demonstrate their widespread influence on gene expression in high-grade serous ovarian carcinoma. PLoS One. 2012;7:e34546. - PMC - PubMed

Publication types