. 2016 Jul 19;16(3):631-43.
doi: 10.1016/j.celrep.2016.06.020. Epub 2016 Jun 30.

Transcription Factor NFIB Is a Driver of Small Cell Lung Cancer Progression in Mice and Marks Metastatic Disease in Patients

Affiliations

Transcription Factor NFIB Is a Driver of Small Cell Lung Cancer Progression in Mice and Marks Metastatic Disease in Patients

Ekaterina A Semenova et al. Cell Rep. .

Abstract

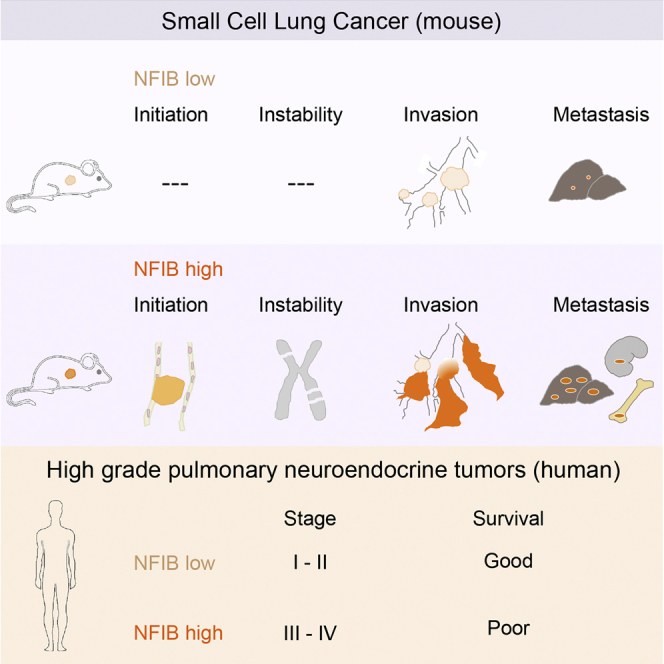
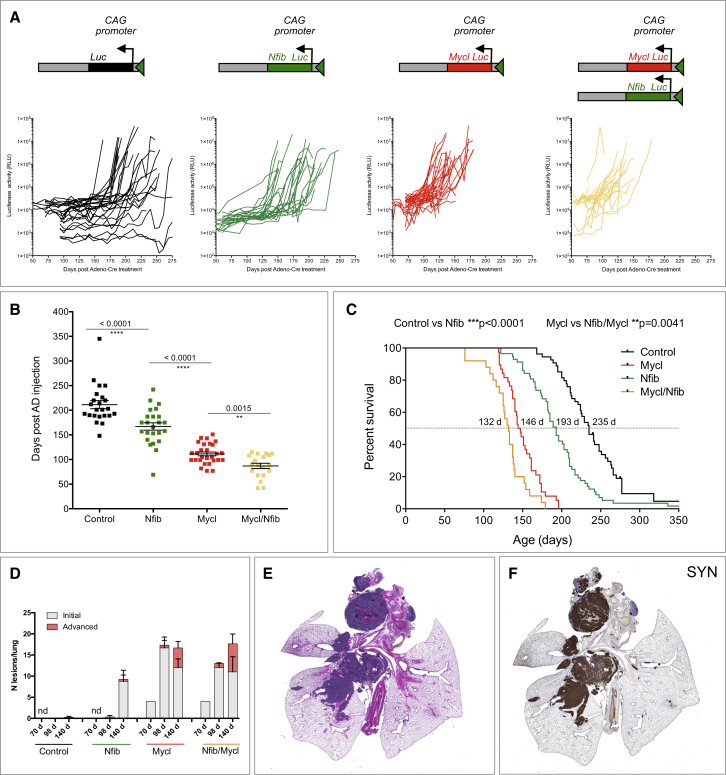
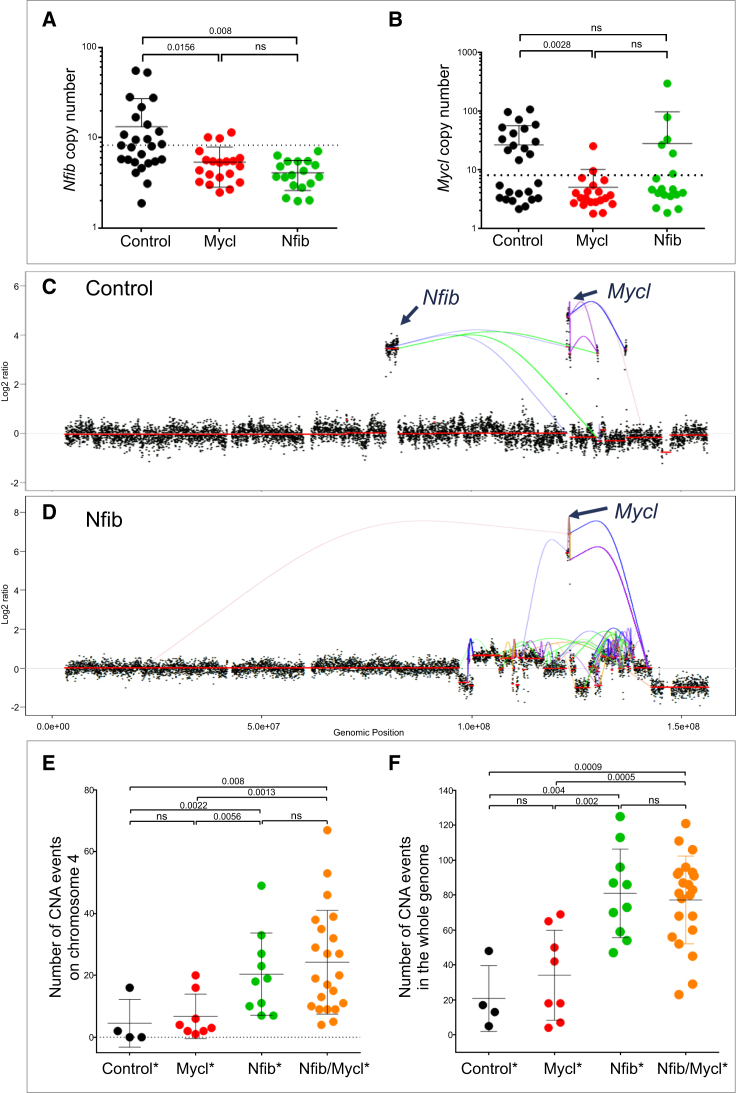
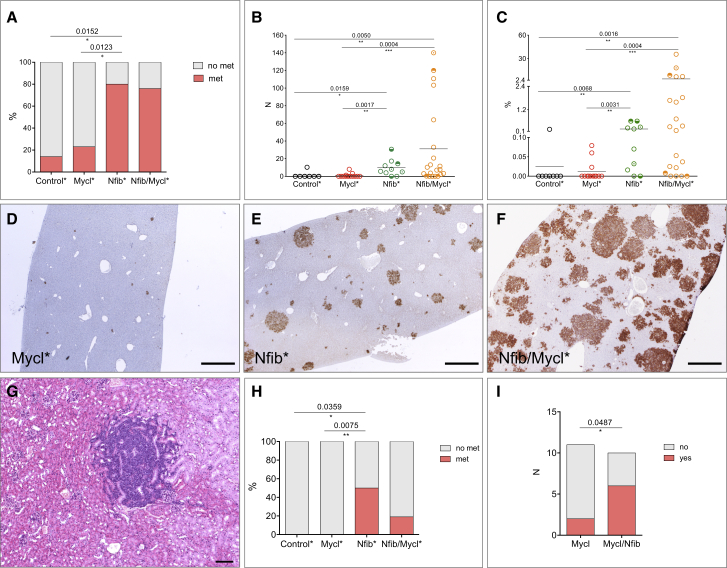
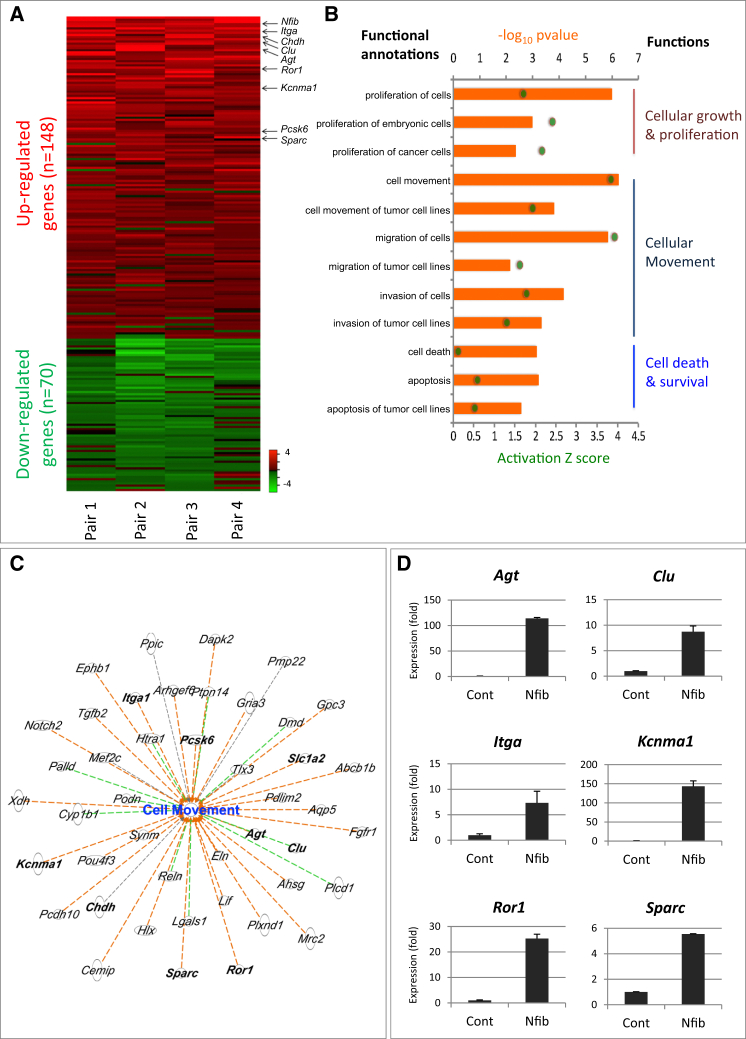
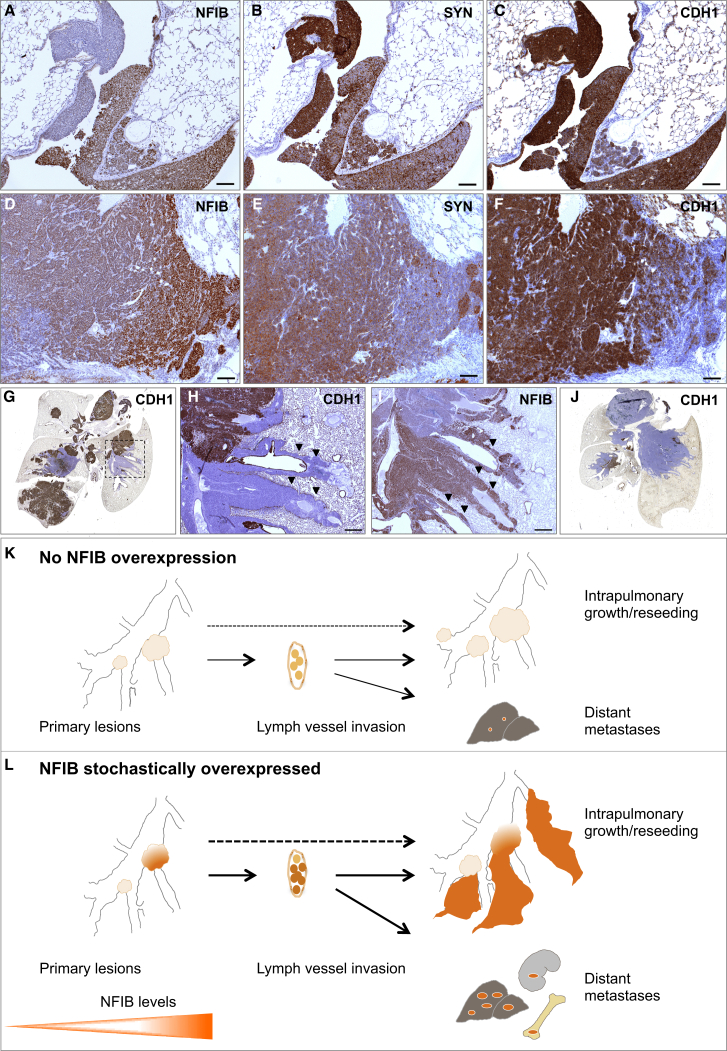
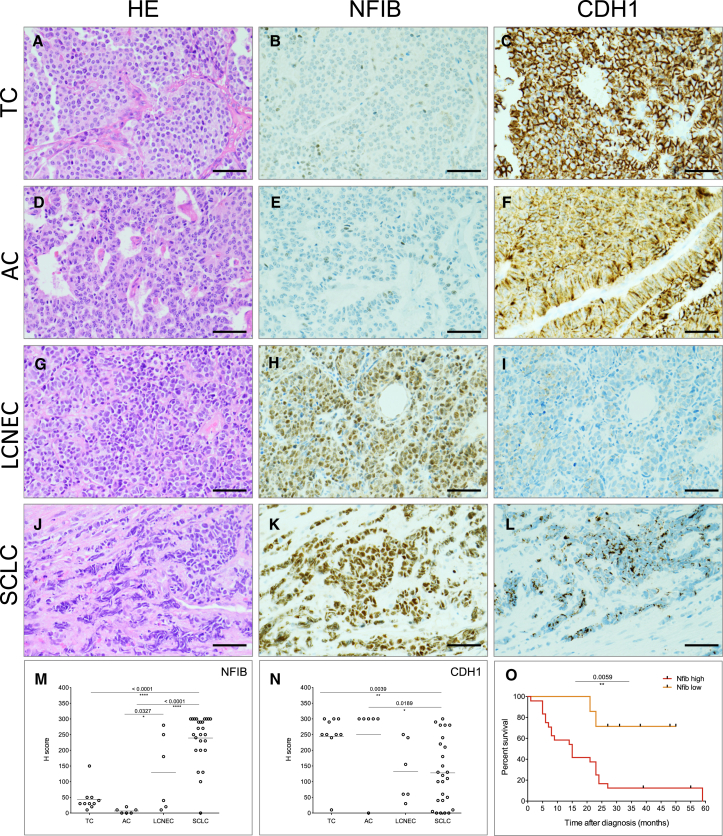
Small cell lung cancer (SCLC) is an aggressive neuroendocrine tumor, and no effective treatment is available to date. Mouse models of SCLC based on the inactivation of Rb1 and Trp53 show frequent amplifications of the Nfib and Mycl genes. Here, we report that, although overexpression of either transcription factor accelerates tumor growth, NFIB specifically promotes metastatic spread. High NFIB levels are associated with expansive growth of a poorly differentiated and almost exclusively E-cadherin (CDH1)-negative invasive tumor cell population. Consistent with the mouse data, we find that NFIB is overexpressed in almost all tested human metastatic high-grade neuroendocrine lung tumors, warranting further assessment of NFIB as a tumor progression marker in a clinical setting.


Figures

None
Graphical abstract
Figure 1
Figure 1
NFIB Accelerates Tumor Initiation and Progression in a Mouse Model of SCLC (A) Schematic representation of the switched targeted transgene and measurements of luciferase activity from thorax over time following viral induction. (B) Time point (in days) at which linear growth switched to exponential growth based on luciferase signal. (C) Survival curves of animals within the four cohorts. (D) Quantification of lesions (initial and advanced) at 70, 98, and 140 days following viral induction. (E) A representative H&E staining of advanced lung lesions (taken from the control cohort, 193 days post-induction). (F) Synaptophysin (SYN) staining of the same lung as in (E). Error bars in (B) and (D) represent mean ± SEM. See also Figures S1, S2, and S3.
Figure 2
Figure 2
NFIB Is Associated with Increased Chromosomal Instability (A and B) Copy number of Nfib (A) and Mycl (B) genomic locus in control, Mycl, and Nfib cohort tumors. The dotted line indicates the threshold. (C and D) Genomic rearrangement and copy-number alterations on chromosome 4 in control (C) and Nfib (D) tumors. Line coloring indicates orientation of fusion ends. (E and F) Total number of copy-number aberration (CNA) events on chromosome 4 (E) and in the whole genome (F) in different tumor classes (indicated by ). Copy-number gain (log2 ratio > 0.459) and loss (log2 ratio < −0.67). Data are mean ± SEM.
Figure 3
Figure 3
NFIB Promotes Metastases and Changes the Metastatic Profile (A) Percent of animals with and without liver metastasis in each of the four classes. (B) Quantification of the number of liver metastasis in each class. (C) Quantification of the percent area of the liver covered by metastatic lesions in each of the four classes. Circles with a shaded upper or lower half indicate animals with kidney and bone metastasis, respectively. Circles marked with a central dot indicate animals with metastasis to both kidney and bone. (D–F) Representative liver section from the three classes, Mycl (D), Nfib (E), and Nfib/Mycl (F), stained with NCAM to identify NE metastatic lesions. (G) NE metastasis in the kidney, H&E. (H) Percent of animals in each class with metastatic lesions outside the liver (bone, kidney). (I) Number of animals in Mycl and Nfib/Mycl cohort that provided successful culture of NE cells from the blood. Scale bars in (D)–(F), 200 μm. Scale bar in (G) represents 100 μm. See also Figure S4.
Figure 4
Figure 4
Key Changes in Cancer Progression Following NFIB Overexpression In Vitro (A) Analysis of the gene expression changes following Nfib overexpression in four mouse SCLC primary cell lines (heatmap). DEGs were selected if expressed in at least three out of four samples. Values are represented as log2 fold change. Red, upregulated (average log2 fold change > 0.5); green, downregulated genes (average log2 fold change < −0.5). (B) Ingenuity pathway analysis (IPA) of differentially expressed genes based on Z score and p value. The biological functions that are expected to be increased according to the gene expression changes in our dataset were identified using the IPA regulation Z score algorithm (green dot). The p value was calculated with the Fischer’s exact test (p value ≤ 0.05). (C) Genes involved in cell movement. Orange dashed line, predicting activation of cell movement; green dashed line, unknown directionality; black dashed line, effect not predicted. (D) Validation of several genes in (C) by qPCR. Error bars represent mean ± SD. See also Figure S5 and Table S1.
Figure 5
Figure 5
NFIB Drives Tumor Dedifferentiation and Invasion (A–C) Early lesions NFIB (A), SYN (B), and CDH1 (C) staining, respectively (Nfib cohort). (D–F) Advanced lesion NFIB (D), SYN (E), and CDH1 (F) staining, respectively (Mycl cohort). (G) Whole lung, CDH1 staining (Mycl cohort). (H and I) Part of the lung indicated with dotted area in (G), CDH1 (H) and NFIB (I), respectively. Invasive sheaths indicated with arrowheads. (J) Whole lung, CDH1 staining (Nfib cohort). (K and L) Diagrams of tumor growth and local and distant metastatic dissemination. NE tumor cells are abundantly found in lymph vessels. Without NFIB overexpression, intrapulmonary dissemination and metastatic load in liver is very limited (K). With NFIB overexpression, there is massive intrapulmonary dissemination, large metastatic load in the liver, and metastasis to kidney and bone (L). Scale bars in (A)–(F) represent 100 μm. Scale bars in (H) and (I) represent 500 μm. See also Figure S6.
Figure 6
Figure 6
NFIB Marks Metastatic Disease in Patients (A–C) Representative image of H&E (A), NFIB (B), and CDH1 (C) expression in typical carcinoid (TC). (D–F) Representative image of H&E (D), NFIB (E), and CDH1 (F) expression in atypical carcinoid (AC). (G–I) Representative image of H&E (G), NFIB (H), and CDH1 (I) expression in large cell NE carcinoma (LCNEC). (J–L) Representative image of H&E (J), NFIB (K), and CDH1 (L) expression in SCLC. (M and N) Quantification of NFIB (M) and CDH1(N) expression in human pNET samples, respectively. (O) Survival curves of patients within high-grade pNET (LCNEC and SCLC). See also Figure S7 and Table S2.

Comment in

References

    1. Andreasen S., Persson M., Kiss K., Homøe P., Heegaard S., Stenman G. Genomic profiling of a combined large cell neuroendocrine carcinoma of the submandibular gland. Oncol. Rep. 2016;35:2177–2182. - PubMed
    1. Augustyn A., Borromeo M., Wang T., Fujimoto J., Shao C., Dospoy P.D., Lee V., Tan C., Sullivan J.P., Larsen J.E. ASCL1 is a lineage oncogene providing therapeutic targets for high-grade neuroendocrine lung cancers. Proc. Natl. Acad. Sci. USA. 2014;111:14788–14793. - PMC - PubMed
    1. Byers L.A., Rudin C.M. Small cell lung cancer: where do we go from here? Cancer. 2015;121:664–672. - PMC - PubMed
    1. Calbo J., van Montfort E., Proost N., van Drunen E., Beverloo H.B., Meuwissen R., Berns A. A functional role for tumor cell heterogeneity in a mouse model of small cell lung cancer. Cancer Cell. 2011;19:244–256. - PubMed
    1. Cermáková K., Tesina P., Demeulemeester J., El Ashkar S., Méreau H., Schwaller J., Rezáčová P., Veverka V., De Rijck J. Validation and structural characterization of the LEDGF/p75-MLL interface as a new target for the treatment of MLL-dependent leukemia. Cancer Res. 2014;74:5139–5151. - PubMed

MeSH terms