. 2016 Jul 19;16(3):644-56.
doi: 10.1016/j.celrep.2016.06.021. Epub 2016 Jun 30.

Identification and Targeting of Long-Term Tumor-Propagating Cells in Small Cell Lung Cancer

Affiliations

Identification and Targeting of Long-Term Tumor-Propagating Cells in Small Cell Lung Cancer

Nadine S Jahchan et al. Cell Rep. .

Abstract

Small cell lung cancer (SCLC) is a neuroendocrine lung cancer characterized by fast growth, early dissemination, and rapid resistance to chemotherapy. We identified a population of long-term tumor-propagating cells (TPCs) in a mouse model of SCLC. This population, marked by high levels of EpCAM and CD24, is also prevalent in human primary SCLC tumors. Murine SCLC TPCs are numerous and highly proliferative but not intrinsically chemoresistant, indicating that not all clinical features of SCLC are linked to TPCs. SCLC TPCs possess a distinct transcriptional profile compared to non-TPCs, including elevated MYC activity. Genetic and pharmacological inhibition of MYC in SCLC cells to non-TPC levels inhibits long-term propagation but not short-term growth. These studies identify a highly tumorigenic population of SCLC cells in mouse models, cell lines, and patient tumors and a means to target them in this most fatal form of lung cancer.


Figures

Figure 1
Figure 1. Mouse SCLC tumors contain a high fraction of cells capable of tumor-propagating cells in transplantation assays
(A) Workflow to identify tumor-propagating cells (TPCs) in a pre-clinical mouse model of SCLC (TKO, Rb/p53/p130 mutant). (B) Representative flow cytometry analysis of TKO SCLC cells with markers of cell death (7AAD), Lineage (CD45, CD31, and Ter119), CD24, CD44, and EpCAM (n>20). (C) Extreme limiting dilution analysis (ELDA) of Lineage-negative (Lin, bulk tumor cells), CD24High CD44Low EpCAMHigh/Low cells sorted from TKO tumors and injected subcutaneously in NSG mice. Refer to Figure S1 for related information.
Figure 2
Figure 2. Xenografts derived from human SCLC circulating tumor cells harbor a high frequency of TPCs and high numbers of CD24High CD44Low EpCAMHigh cells
(A) Workflow to generate xenografts (CDXs) derived from human SCLC circulating tumor cells (CTCs). (B) Expression (RPKM, from RNA-seq) of two genes expressed at high levels in SCLC (ASCL1, SYP) compared to the TPC markers EPCAM, CD24, and CD44 (n=3 CDXs). Negative controls: FOXN1, thymic and skin epithelium; MYBPC3, heart. Levels of the three MYC genes are also shown. (C) Immunostaining for EpCAM and CD44 (brown signal) on CDX models. Lymphoma SUDHL8 cells were used as a negative control for EpCAM (inset) and H196 lung cancer cells were used as a positive control for CD44 (inset). Counterstain, hematoxylin. Scale bars, 100μm. (D) Extreme limiting dilution analysis (ELDA) of cells from the CDX2, CDX3, and CDX4 models. Note that the data for CDX2 and CDX4 are not statistically different but the lower frequency for CDX3 is (p-values of 1.12×10−07 for the CDX2 comparison and 3.51×10−05 for CDX4). Refer to Figure S2 for related information.
Figure 3
Figure 3. Serial transplantation reveals a stable TPC phenotype in the murine CD24High CD44Low EpCAMHigh SCLC cell population
(A) Serial transplantation assays (passages P1, P2, P3) of sorted Lineage-negative cells (Lin: CD45, CD31, and Ter119) and TPCs (CD24High CD44Low EpCAMHigh) from TKO tumors (passage 0, P0). The estimated frequency of tumor formation is shown in red. Tumors from two TKO mice were passaged to P3 and analysis was done on 2 allografts per passage for each. (B) Representative sections from the Lin P1, TPC P1, TPC P2, and TPC P3 allografts counterstained with hematoxylin and eosin (H&E) or immunostained for the neuroendocrine marker Uchl1. Scale bars, 50μm. (C) Representative FACS plots of TPCs (red boxes) and non-TPCs (black boxes) from Lin P1, TPC P1, TPC P2, and TPC P3 allografts (n>2). (D) Representative FACS histograms of TPCs and non-TPCs (CD24High CD44Low EpCAMLow) tumor subpopulations labeled with the DNA replication marker EdU. (E) Bar chart showing the frequency of EdU+ cycling cells in TPCs and non-TPCs (CD24High CD44Low EpCAMLow) tumor subpopulations from 3 different Rb/p53/p130 mutant mice. CD24High CD44high and CD24Low populations also showed non-significant differences in EdU incorporation (data not shown). Error bars indicate mean+/−SEM (n=3 mice); p-values are from paired t-test (p=0.1151); ns, not significant. Refer to Figure S3 for information related to the frequency of the TPC population.
Figure 4
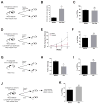
Figure 4. The murine CD24High CD44Low EpCAMHigh TPC population is not inherently chemoresistant
(A) Strategy used for the acute treatment of Rb/p53/p130 TKO mutant mice with saline and high doses of cisplatin (7.5mg/kg) + etoposide (15mg/kg) for 4 days. (B) Analysis of cleaved caspase 3 (CC3) apoptotic cells on sections from TKO tumors treated acutely with saline or cisplatin and etoposide. Error bars indicate mean+/−SEM (n=3 mice); p-value is from a two-tailed unpaired Student’s t-test (p=0.0442). (C) Relative frequency of CD24High CD44Low EpCAMHigh cells from treated TKO mice. Error bars indicate mean+/−SEM (n=3 mice); ns, not significant, in a two-tailed unpaired Student’s t-test (p=0.8490). (D) Strategy used for the treatment of Rb/p53/p130;Rosa26lox-Stop-lox-Luciferase mice with saline and cisplatin (5mg/kg) once a week for 3 weeks. (E) Fold-change of the tumor volume measured by luciferase activity in saline- and cisplatin-treated mice. Error bars indicate mean+/−SEM (n=3 mice); p-value is from a two-tailed unpaired Student’s t-test (p=0.0455). (F) Relative frequency of TPCs (CD24High CD44Low EpCAMHigh) in treated mice. Error bars indicate mean+/−SEM (n=3 mice); ns, not significant, in a two-tailed unpaired Student’s t-test (p=0.2674). (G) Strategy used for the treatment of P2 allografts transplanted into NSG mice from single TKO tumors; pairs were treated with saline or cisplatin (5mg/kg) once a week for 3 weeks. (H) Tumor mass from saline- (n=8 tumors) and cisplatin- (n=5 tumors) treated allografts. Error bars indicate mean+/−SEM; p-value is from a two-tailed unpaired Student’s t-test (p=0.0431). (I) Relative frequency of TPCs (CD24High CD44Low EpCAMHigh) in treated allografts. Error bars indicate mean+/−SEM (n=3 mice); ns, not significant, in a two-tailed unpaired Student’s t-test (p=0.1191). (J) Strategy used for the treatment of Rb/p53/p130;Rosa26lox-Stop-lox-Luciferase mice developing endogenous SCLC tumors and treated with saline or cisplatin (3mg/kg) weekly to generate chemonaïve and chemoresistant tumors (from Jahchan et al., 2013). (K) Relative frequency of TPCs (CD24High CD44Low EpCAMHigh) in treated mice. Error bars indicate mean+/−SEM (n=3 saline- and 3 cisplatin-treated mice); ns, not significant, in a two-tailed unpaired Student’s t-test (p=0.2172). Refer to Figure S4 for related information.
Figure 5
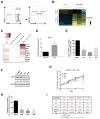
Figure 5. SCLC TPCs retain their neuroendocrine differentiation and have elevated Mycl1 levels
(A) Representative FACS plots to isolate TPCs (red gates, CD24High CD44Low EpCAMHigh) and non-TPCs (black gates, CD24Low; CD24High CD44High; CD24High CD44Low EpCAMLow) populations in TKO tumors (n>3). (B) Heatmap of the microarray analysis comparing TPCs and non-TPCs sorted from 3 different TKO mice. Yellow and blue indicate high and low expression, respectively. The values of the scale bar represent the median-centered log2 fold-change of each gene. Hierarchical clustering was performed on genes whose expression is at least 1.5-fold different between the two groups. (C) Top 10 overrepresented transcription factors in the TPC population (based on total count of significantly enriched genesets). (D) Quantitative RT-PCR analysis of Mycl1 mRNA levels in TPCs relative to non-TPCs (set to 1) from 3 TKO mice and one TKO P1 allograft. Arpp0 was used as an internal control to compare the different tumors. Error bars indicate mean+/−SEM (n=4 samples); p-values are from two-tailed paired Student’s t-test (p=0.0323). (E) Quantitative RT-PCR analysis of Mycl1 mRNA levels in mouse Kp3 SCLC cells with shRNA knockdown using three different hairpins (sh6, sh7, and sh8). Arpp0 and B-actin were used as internal controls and data were plotted relative to the sh-scrambled vector control (shscr) (n=2 independent experiments; mean+/−SEM). p-values are from a two-tailed paired Student’s t-test (p=0.0142 for sh7). (F) Representative L-Myc immunoblotting from Kp3 cells infected with a control vector (shGFP), and three sh-Mycl1 vectors. Hsp90 was used as a loading control. Quantification of the bands for L-Myc is shown below the blot. (G) Cell growth assay (MTT) in Kp3 cells at different days upon Mycl1 knockdown. Fold growth is normalized to day 0. n=4 independent biological replicas with 3 technical replicas each; mean+/−SEM. Statistical significance was determined by two-tailed paired Student’s t-test (p= 0.016 at day 4 and p= 0.0416 at day 6 for sh8, all the other comparisons are not significantly different). (H) Average of the number of colonies formed after single-cell sorting of Kp3 cells into 96-well plates. n=3 (for sh6) and n=4 (for sh7 and sh8) independent experiments with 3 technical replicas each; mean+/−SEM. Statistical significance was determined by two-tailed paired Student’s t-test (p= 0.0402 for sh6, p= 0.0017 for sh7, and p=0.0079 for sh8). (I) Extreme limiting dilution analysis (ELDA) of shscr, sh6, sh7, and sh8 (Mycl1 knockdown) in mouse Kp1 SCLC cells injected at different dilutions into NSG recipient mice to assess tumor formation in vivo. Refer to Figure S5 for related information.
Figure 6
Figure 6. Lowering Mycl1 levels in murine SCLC cells with JQ1 decreases the frequency of TPCs and inhibits the tumorigenic potential of these cells
(A) MTT viability assay for mouse Kp1 SCLC cells after 48 hours of treatment with increasing doses of JQ1. Values from three independent experiments are shown as mean+/−SEM. The two-tailed paired Student’s t-test was used to calculate the p-values of the drug-treated cells versus control cells (p=0.0222 for JQ1 100nM; ns, not significant). (B) Average of the number of colonies formed after single-cell sorting of Kp1 cells into 96-well plates. n=9 for JQ1 100nM and n=7 for JQ1 250nM; independent experiments with 3 technical replicas each; mean+/−SEM. Statistical significance was determined by two-tailed paired Student’s t-test (p=0.0003 for JQ1 100nM and p=0.0019 for JQ1 250nM). (C) Quantitative RT-PCR analysis of Mycl1, Myc, and Mycn mRNA levels in mouse Kp1 SCLC cells treated with increasing doses of JQ1 for 24 hours. Arpp0 was used as an internal control and the numbers were plotted relative to the DMSO-treated Kp1 cells (n=6 independent experiments for JQ1 100nM and n=4 independent experiments for JQ1 250nM; mean+/−SEM). p-values are from a two-tailed paired Student’s t-test (p=0.0010 for Mycl1 and p=0.0464 for Mycn for JQ1 100nM, and p=0.0061 for Mycl1 and p=0.0450 for Mycn for JQ1 250nM; ns, not significant). (D) Extreme limiting dilution analysis (ELDA) of Kp1 cells injected at different dilutions into NSG recipient mice to assess the frequency of tumor formation in vivo when treated with vehicle alone (Ctrl) or with JQ1 at 25mg/kg starting at day 0 of transplantation for 2 weeks. NA, not applicable. (E) Relative frequency of TPCs (CD24High CD44Low EpCAMHigh) in Kp1 cells treated with DMSO, or with 100nM and 250nM of JQ1 for 5 days. Error bars indicate mean+/−SEM (n=5 independent experiments); p-values are from two-tailed paired Student’s t-test (p=0.0230 for 100nM and p<0.0001 for 250nM). (F) Average of the number of colonies formed after single-cell sorting into 96 well plates of pre-treated Kp1 cells with DMSO, JQ1 at 100nM (pre-JQ100), and JQ1 at 250nM (pre-JQ250) for 5 days. n=2 independent experiments with 3 technical replicas each; mean+/−SEM. Statistical significance was determined by two-tailed paired Student’s t-test (p= 0.0043 for pre-JQ250); ns, not significant. (G) ELDA of pre-treated Kp1 cells with DMSO, and with JQ1 at 100nM and 250nM (JQ1 pre-treated) for 5 days that are injected at different dilutions into NSG recipient mice to assess the frequency of tumor formation in vivo. (H) Quantitative RT-PCR analysis of Mycl1 mRNA levels in Kp1 cells stably infected with the pCDH-puro-L-Myc vector relative to uninfected Kp1 cells (Ctrl) (set to 1). Gapdh and ARPP0 were averaged and used as internal controls. Error bars indicate mean+/−SEM. p-values are from a two-tailed paired Student’s t-test (n=2 repeats; p=0.0063). (I) Number of colonies from a single-cell sort of Kp1 cells stably infected with pCDH-puro-L-Myc and control uninfected Kp1 cells in media containing DMSO, 100nM, and 250nM of JQ1. Error bars indicate mean+/−SEM (n=3 independent experiments). Statistical significance was determined by two-tailed paired Student’s t-test between all the groups (p=0.046 and p=0.013 for the effects of JQ1 at 100mM and 250mM, respectively; p=0.021 for the effects of JQ1 in L-Myc-expressing cells both at 100mM and 250mM; p=0.0015 for the rescue effects of L-Myc on cells treated with JQ1 at 100mM; the effects of L-Myc on control cells are not significant). Refer to Figure S6 for related information.
Figure 7
Figure 7. Lowering Mycl1 levels in murine SCLC cells with JQ1 decreases the frequency of TPCs and inhibits the tumorigenic potential of these cells
(A) Strategy used for sorting TPCs from TKO tumors and injecting them into recipient NSG mice treated with 25mg/kg of JQ1 for the first 2 weeks. (B) Extreme limiting dilution analysis (ELDA) of the sorted TPCs in the vehicle (Ctrl) - and JQ1-treated groups was performed at the end of the experiment to assess the frequency of tumor formation in vivo. (C) Representative images of the P1 allografts from the sorted TPCs injected in recipient NSG mice with the number of cells indicated and treated with vehicle (ctrl) or 25mg/kg of JQ1 for the first 2 weeks. (D) Strategy used for the treatment of TKO mice 5.5 months after Adeno-Cre instillation with 25mg/kg of JQ1. (E) Representative FACS plots of CD24High CD44Low EpCAMHigh and CD24High CD44Low EpCAMLow from tumors isolated from the vehicle (ctrl)- and JQ1- treated Rb/p53/p130 mutant mice ~1 month following treatment (n=4). (F) Frequency of TPCs (CD24High CD44Low EpCAMHigh) in Ctrl and JQ1-treated mice. Error bars indicate mean+/−SEM (n=4 pairs); p-values are from two-tailed paired Student’s t-test (p=0.0151). (G) Survival curve generated from the Rb/p53/p130 mutant mice treated daily with IP injections of vehicle (Ctrl) and 25mg/kg of JQ1 starting at 5.5 months after Adeno-Cre instillation (Day 0 of treatment); median survival is 20.50 days for the vehicle- and 37 days for the JQ1-treated mutant mice; p=0.0043 by the Mantel-Cox test (n=12 vehicle-treated mice and n=12 JQ1-treated mice). Refer to Figure S7 for related information.

References

    1. de Alves RC, Meurer RT, Roehe AV. MYC amplification is associated with poor survival in small cell lung cancer: a chromogenic in situ hybridization study. J Cancer Res Clin Oncol. 2014;140:2021–2025. - PMC - PubMed
    1. Anderson WC, Boyd MB, Aguilar J, Pickell B, Laysang A, Pysz MA, Bheddah S, Ramoth J, Slingerland BC, Dylla SJ, Rubio ER. Initiation and characterization of small cell lung cancer patient-derived xenografts from ultrasound-guided transbronchial needle aspirates. PLoS One. 2015;10:e0125255. - PMC - PubMed
    1. Augustyn A, Borromeo M, Wang T, Fujimoto J, Shao C, Dospoy PD, Lee V, Tan C, Sullivan JP, Larsen JE, et al. ASCL1 is a lineage oncogene providing therapeutic targets for high-grade neuroendocrine lung cancers. Proc Natl Acad Sci U S A. 2014;111:14788–14793. - PMC - PubMed
    1. Bauer DE, Mitchell CM, Strait KM, Lathan CS, Stelow EB, Luer SC, Muhammed S, Evans AG, Sholl LM, Rosai J, et al. Clinicopathologic features and long-term outcomes of NUT midline carcinoma. Clin Cancer Res. 2012;18:5773–5779. - PMC - PubMed
    1. Beck B, Blanpain C. Unravelling cancer stem cell potential. Nat Rev Cancer. 2013;13:727–738. - PubMed