. 2016 Jul 19;16(3):744-56.
doi: 10.1016/j.celrep.2016.06.019. Epub 2016 Jun 30.

Activation of CDK4 Triggers Development of Non-alcoholic Fatty Liver Disease

Affiliations

Activation of CDK4 Triggers Development of Non-alcoholic Fatty Liver Disease

Jingling Jin et al. Cell Rep. .

Abstract

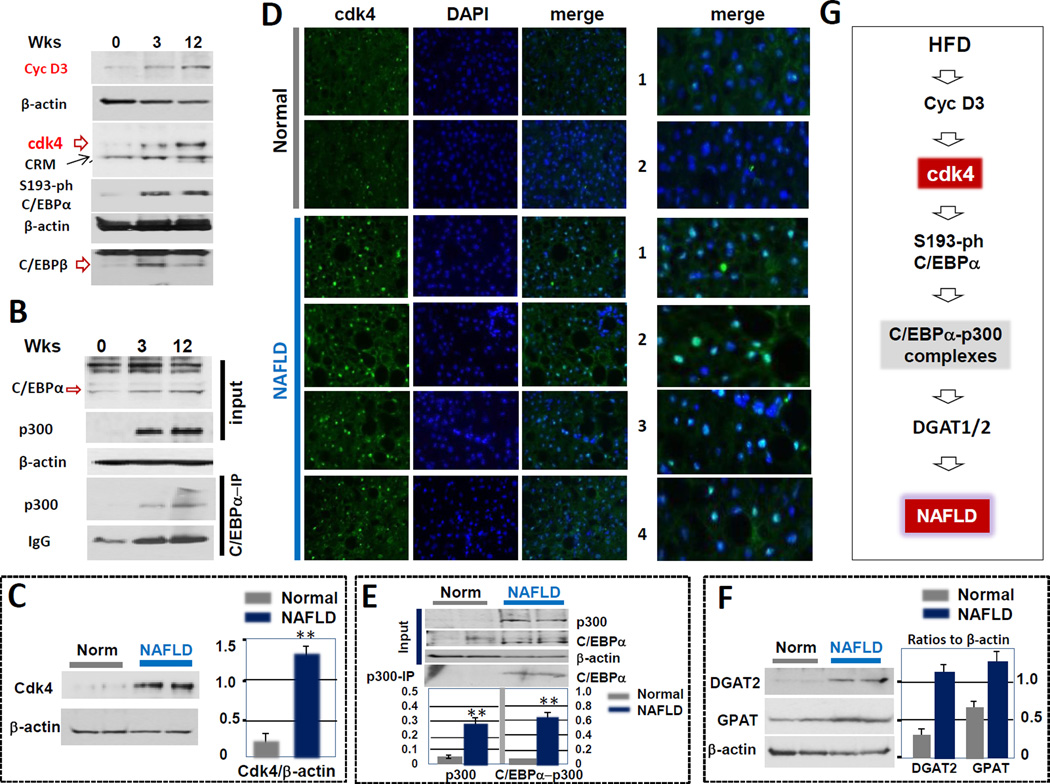
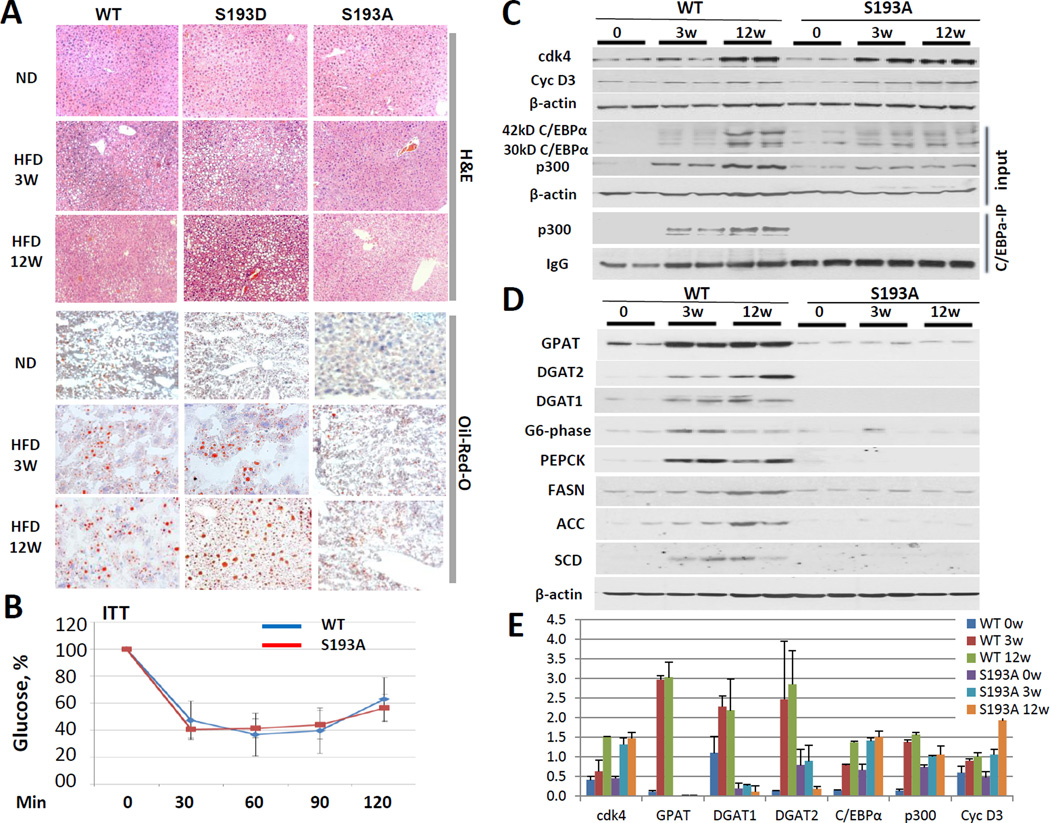
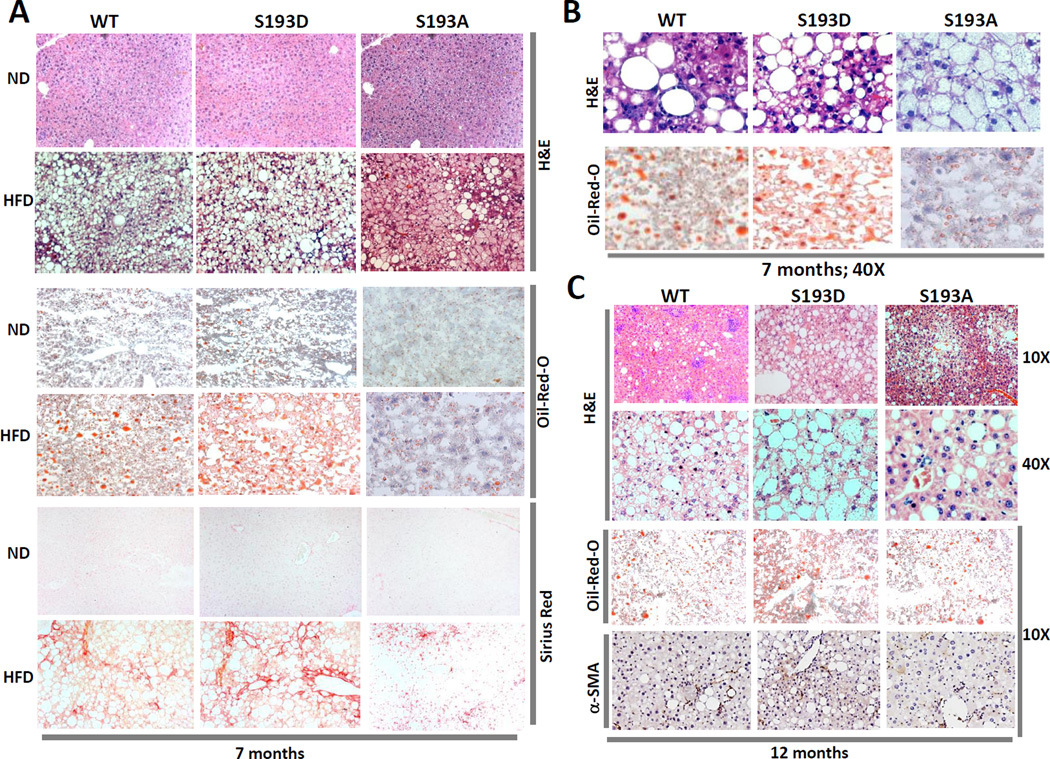
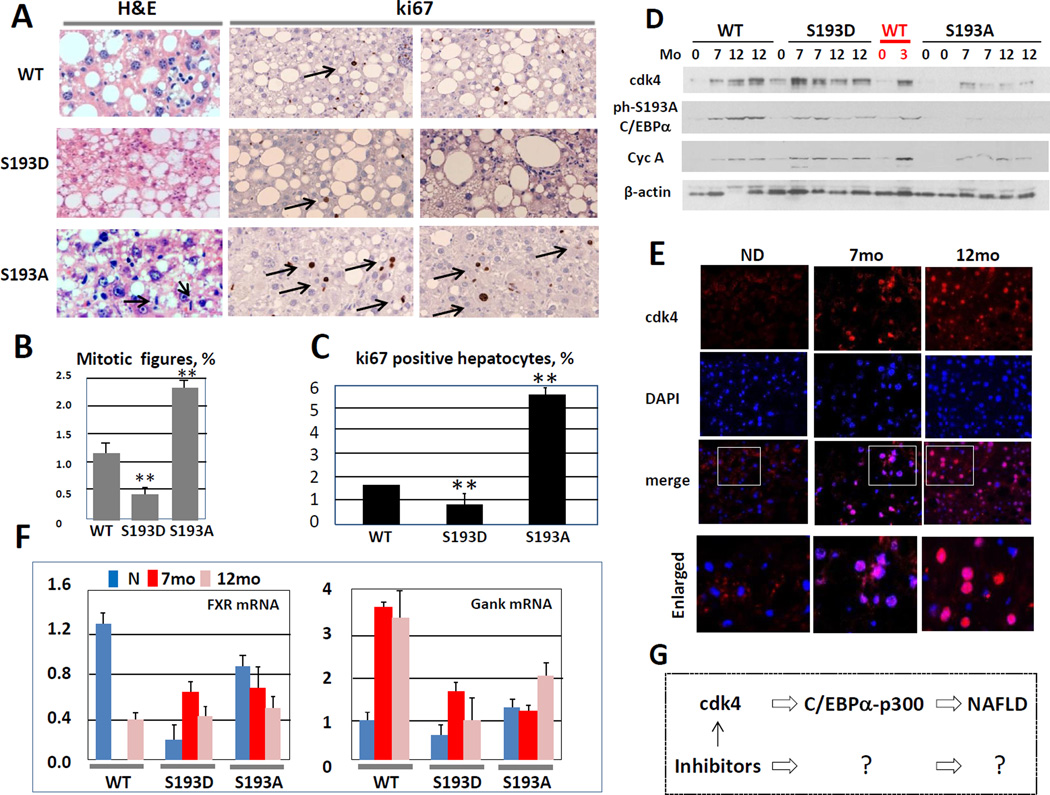
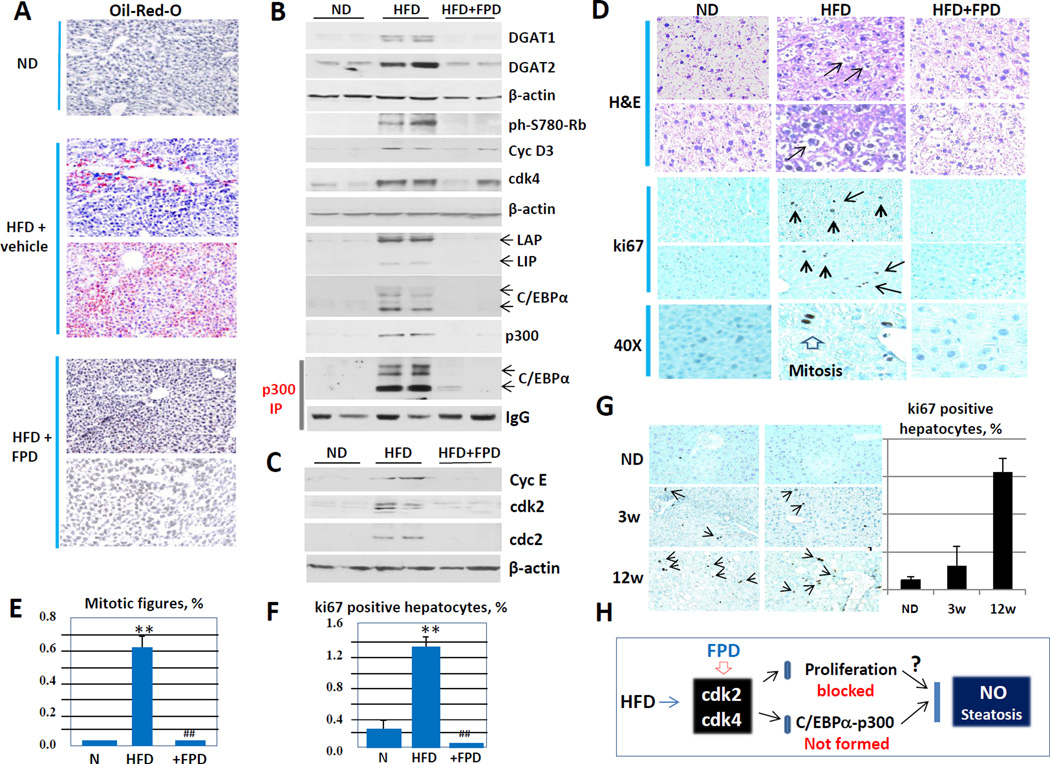
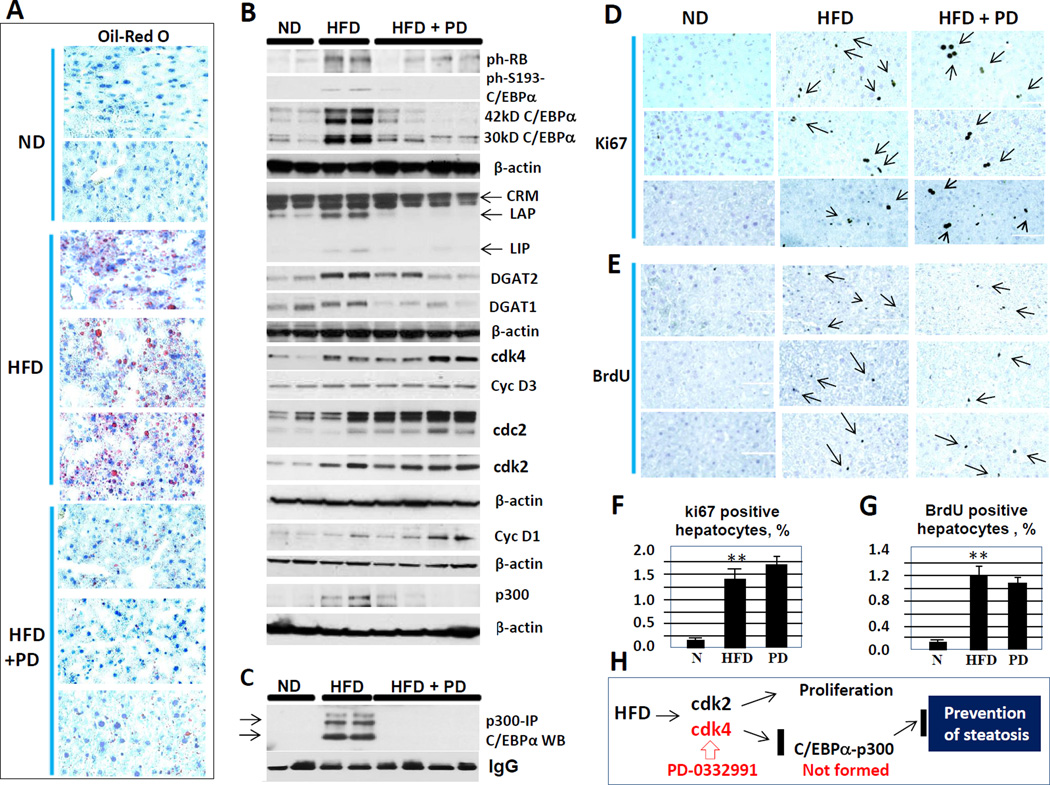
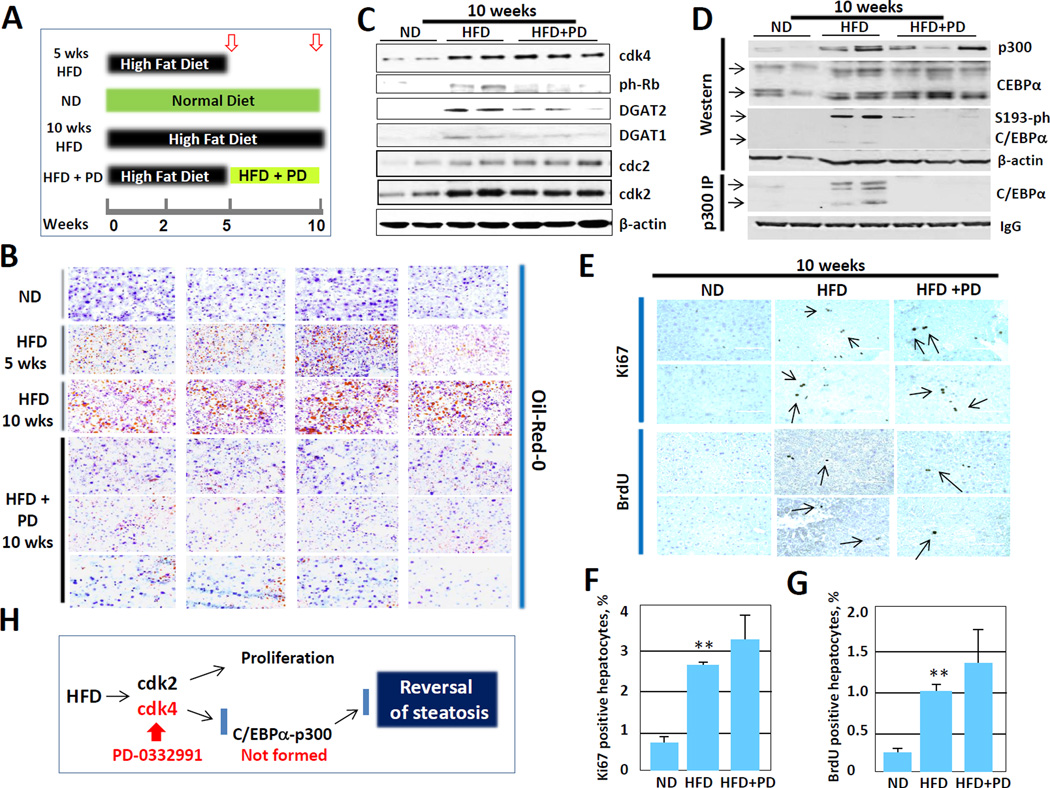
The development of non-alcoholic fatty liver disease (NAFLD) is a multiple step process. Here, we show that activation of cdk4 triggers the development of NAFLD. We found that cdk4 protein levels are elevated in mouse models of NAFLD and in patients with fatty livers. This increase leads to C/EBPα phosphorylation on Ser193 and formation of C/EBPα-p300 complexes, resulting in hepatic steatosis, fibrosis, and hepatocellular carcinoma (HCC). The disruption of this pathway in cdk4-resistant C/EBPα-S193A mice dramatically reduces development of high-fat diet (HFD)-mediated NAFLD. In addition, inhibition of cdk4 by flavopiridol or PD-0332991 significantly reduces development of hepatic steatosis, the first step of NAFLD. Thus, this study reveals that activation of cdk4 triggers NAFLD and that inhibitors of cdk4 may be used for the prevention/treatment of NAFLD.

Keywords: C/EBP; NAFLD; cdk4; cyclin D3; hepatic steatosis; p300.


Figures

Figure 1
Figure 1. Cdk4 is activated in animal models of NAFLD and in patients with NAFLD
(A) Cyclin D3/ckd4-C/EBP-p300 pathway is activated in mouse livers after HFD treatment. Western blotting shows that cyclinD3, cdk4, ph-C/EBPα, p300 are increased in livers after HFD treatment. (B) C/EBPα-p300 complexes are elevated during development of hepatic steatosis in mice. C/EBPα was immunoprecipitated from nuclear extracts and IPs were examined by Western blotting with antibodies to p300. Upper image shows input of the proteins. IgG; signals of immunoglobulins on the IP membranes. Images on Fig 1A and B represent typical pictures of three independent experiments with three mice at each time point. Examination of additional mice are also shown in Fig 2C. (C) Protein levels of cdk4 are increased in livers of patients with fatty liver disease. Western blotting was performed with total protein extracts isolated from the livers. The membrane was re-probed with antibodies to β-actin. Bar graphs show a summary of three independent experiments. (D) Immunostaining of normal livers and livers from 4 patients with fatty liver diseases using antibodies to cdk4. The slides were stained with DAPI. The right panel shows enlarged pictures of merged images. (E) Protein levels of p300 and C/EBPα-p300 complexes are increased in livers of patients with fatty liver disease. Upper image: Western blotting was performed with total protein extracts isolated from the livers. The membrane was re-probed with antibodies to β-actin. Bar graphs show calculations of p300 and C/EBPα-p300 complexes as ratios to β-actin. (F) Amounts of DGAT2 and GPAT are increased in livers of patients with fatty liver diseases. Western blotting was performed with total protein extracts isolated from the livers. The membranes were re-probed with antibodies to β-actin. Bar graphs show levels of GPAT and DGAT1 as ratios to β-actin. (G) A model showing hypothetical mechanisms for the development of NAFLD (see text).
Figure 2
Figure 2. Cdk4-resistant C/EBPα-S193A mice do not develop hepatic steatosis under conditions of HFD protocol
(A) S193A mice do not develop hepatic steatosis, while S193D mice are developing hepatic steatosis much faster than wild type mice after 3 weeks and 12 weeks of HFD conditions. A typical picture of H&E and Oil-Red O staining of WT, S193D and S193A livers (five mice of each genotype) is shown in three and 12 weeks after initiation of HFD. Scale bar: 40 µm. (B) Insulin-dependent lowering of glucose is not affected in S193A mice. Insulin Tolerance Test was performed with WT and S193A mice as shown in Supplement Materials. (C) Cyclin D3-cdk4 pathway is identically elevated in WT and S193A mice, but C/EBPα-p300 complexes are not formed in livers of S193A mice. Western blotting was performed with antibodies to cdk4, cyclin D3, C/EBPα and p300. Bottom image: C/EBPα was immunoprecipitated from nuclear extracts and p300 was examined in these IPs. IgG, signals of immunoglobulins detected on the membrane. (D) Expression of enzymes of TG synthesis, glucose synthesis and lipid metabolism. Cytoplasmic extracts from WT and S193A mice were probed with antibodies shown on the left. Membranes were re-probed with antibodies to β-actin. (E) Levels of proteins on Fig 2C and D were calculated as ratios to β-actin. The bar graphs show a summary three repeats with three mice per each time point. Additional calculations are shown in Supplemental Figure 2.
Figure 3
Figure 3. Development of NAFLD and fibrosis is inhibited in S193A mice after 7 and 12 months of HFD treatments
(A) A typical pictures of H&E, Oil-Red-O and Sirius Red stinging of WT, S193D and S193A livers under HFD conditions. Upper image shows H&E staining of the livers, middle image shows Oil-Red O staining, bottom image shows Sirius Red staining. Scale bar: 40 µm. (B) Sections of H&E staining under high magnification. (C) A typical picture of H&E and Oil-Red-O stinging of WT, S193D and S193A livers under 12 months of HFD conditions. Upper image shows H&E staining of the livers and bottom image shows Oil-Red O and α-SMA staining. Scale bar: 40 µm. The figure shows typical pictures obtained with livers of five mice of each genotype.
Figure 4
Figure 4. 12 months treatments with HFD lead to increased liver proliferation and to initiation of cancer-specific FXR-Gank pathway
(A) Left panel: H&E staining shows mitotic figures. Right image shows ki67 staining of livers after 12 months of HFD. (B) Bar graphs show number of mitotic figures in WT, S193D and S193A mice per 1,000 hepatocytes. (C) Bar graphs show percent of ki67 positive hepatocytes. Three animals of each genotype were used for calculations of mitotic figures and BrdU uptake. (D) cdk4-cyclin D3 pathway in WT, S193D and S193A mice at 7 and 12 months after initiation of HFD protocol. Nuclear extracts were isolated from livers and used for Western blotting with Abs shown on the left. (E) Amounts of cdk4 are increased in nuclei of hepatocytes after HFD treatment. Liver sections were stained with antibodies to cdk4 and with DAPI. Enlarged images of merged pictures are shown on the bottom. (F) Cancer-specific FXR-Gank pathway is activated in WT, S193D and S193A mice after 7 and 12 months of HFD. Expression of FXR and Gankyrin was determined in livers after 7 and 12 months of HFD. Three animals for each genotype were used in these studies. (G) A diagram which summarizes examination of mechanisms of NAFLD in genetically modified animal models.
Figure 5
Figure 5. Inhibition of cdk2/cdk4 activities by flavopiridol prevents development of hepatic steatosis and inhibits liver proliferation
(A) Oil-Red-O staining of livers of mice treated with normal diet, with HFD +vehicle and with HFD +FPD. (B) Western blotting of protein extracts with antibodies to enzymes of TG synthesis DGAT1 and DGAT2 and examination of cdk4-C/EBPα pathway in livers of mice treated with HFD and HFD +FPD. Western blotting was performed with Ab shown on the right. LAP and LIP are isoforms of C/EBPβ. Bottom image shows Co-IP studies in which p300 was immunoprecipitated and C/EBPα was examined in these IPs. (C) Expression of cell cycle proteins was examined by Western blotting. (D) H&E and ki67 staining of livers of mice treated with normal diet (ND), with high fat diet (HFD); and with HFD plus Flavopiridol (HFD+FPD). 40X shows ki67 staining under 40X magnification. (E) Percent of mitotic figures. (F) % of ki67 positive hepatocytes. Four animals of each group were used for calculations of mitotic figures and ki67 staining. (G) Liver proliferation was examined in mice after 3 and 12 weeks of HFD using ki67 staining. Left images show typical pictures of ki67 staining. Bar graphs show % of ki67 positive hepatocytes. (H) A diagram summarizing examination of effects of FPD on HFD-mediated steatosis and liver proliferation.
Figure 6
Figure 6. Inhibition of cdk4 by specific inhibitor PD-0332991 prevents development of steatosis, but does not block liver proliferation
(A) Oil-red-O staining of levers of mice treated with normal diet, with HFD and with HFD + PD-0332991. (B) Western blotting with antibodies shown on the right. LAP and LIP are isoforms of C/EBPβ protein. CRM; cross reactive molecule. (C) Examination of C/EBPα-p300 complexes by Co-IP approach. (D and E) Examination of liver proliferation by ki67 staining and BrdU-uptake. Typical pictures are shown. (F and G) Bar graphs show % of ki67 positive and BrdU positive hepatocytes. (H) A diagram summarizing examination of effects of PD-0332991 on HFD-mediated steatosis and liver proliferation. Data in this figure show analyses of four-five mice of each group.
Figure 7
Figure 7. Inhibition of cdk4 in mice with existing hepatic steatosis dramatically reduces steatosis
(A) A diagram showing the strategy of experiments. (B) Oil-Red-O staining of livers. Typical pictures of 4 mice per each group are shown. (C) Inhibition of cdk4 activity by PD-0332991 and expression of DGAT1 and DGAT2 proteins. Western was performed with Abs shown on the right. (D) Inhibition of cdk4 activity by PD-0332991 reduces amounts of C/EBPα-p300 complexes. Input: Western blotting with Abs to C/EBPα and p300 showing expression and input of these proteins. P300-IP: examination of p300 immunoprecipitates by Western blotting with Abs to C/EBPα. 42kD and 30kD C/EBPα isoforms are shown by arrows. (E) Typical pictures of ki67 staining and BrdU uptake. (F and G) % of ki67 positive and BrdU positive hepatocytes was calculated. Bar graphs represent summary of analyses of five mice per each group. (H) A diagram showing the results of reversion of HFD-mediated steatosis by PD-0332991-mediated inhibition of cdk4.

References

    1. Anders L, Ke N, Hydbring P, Choi YI, Widlund HR, Chick JM, Zhai H, Vidal M, Gygi S, Braun P, Sicinski P. A systematic screen for cdk4/6 substrates links FOXM1 phosphorylation to senescence suppression in cancer cells. Cancer Cell. 2011;20:620–634. - PMC - PubMed
    1. Baker SJ, Reddy FE. CDK4: A key player in the Cell Cycle, Development and Cancer. Genes & Cancer. 2013;3:658–669. - PMC - PubMed
    1. Carr RM, Reid AE. FXR agonists as therapeutic agents for non-alcoholic fatty liver disease. Curr Atheroscler Rep. 2015 Apr;17(4):500. - PubMed
    1. Cohen CJ, Horton JD, Hobbs HH. Human Liver Disease: old questions and new insights. Science. 2011;332:1519–1523. - PMC - PubMed
    1. Dickson MA, Schwarz GK. Development of cell-cycle inhibitors for cancer therapy. Current Oncology. 2009;16:36–43. - PMC - PubMed

MeSH terms

Substances