. 2016 Jul 7;63(1):167-78.
doi: 10.1016/j.molcel.2016.05.032. Epub 2016 Jun 30.

Prevalent, Dynamic, and Conserved R-Loop Structures Associate with Specific Epigenomic Signatures in Mammals

Affiliations

Prevalent, Dynamic, and Conserved R-Loop Structures Associate with Specific Epigenomic Signatures in Mammals

Lionel A Sanz et al. Mol Cell. .

Abstract

R-loops are three-stranded nucleic acid structures formed upon annealing of an RNA strand to one strand of duplex DNA. We profiled R-loops using a high-resolution, strand-specific methodology in human and mouse cell types. R-loops are prevalent, collectively occupying up to 5% of mammalian genomes. R-loop formation occurs over conserved genic hotspots such as promoter and terminator regions of poly(A)-dependent genes. In most cases, R-loops occur co-transcriptionally and undergo dynamic turnover. Detailed epigenomic profiling revealed that R-loops associate with specific chromatin signatures. At promoters, R-loops associate with a hyper-accessible state characteristic of unmethylated CpG island promoters. By contrast, terminal R-loops associate with an enhancer- and insulator-like state and define a broad class of transcription terminators. Together, this suggests that the retention of nascent RNA transcripts at their site of expression represents an abundant, dynamic, and programmed component of the mammalian chromatin that affects chromatin patterning and the control of gene expression.


Figures

Figure 1
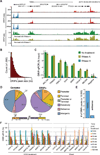
Figure 1. Distribution, frequency, and dynamics of RNA:DNA hybrids
(A) Screenshot of a representative genomic region. DRIPc data is shown in red (+ strand) and blue (− strand) (two independent replicates). DRIP-seq data is in green; DRIP-seq data after RNase A and RNase H pre-treatment is shown below (in khaki and teal, respectively). (B) Distribution of DRIPc peak numbers as a function of peak size. (C) Bar chart of DRIP-qPCR (as % input) for a various loci. Each bar is the average of two independent experiments (shown with standard error). The effect of RNase A and RNase H pre-treatment on DRIP-qPCR is shown. (D) Location analysis of DRIPc peaks (right) compared to expected genomic distribution (left). The various regions are color-coded as per cartoon below. ‘X’ refers to an extended 3 kb region, as shown. (E) Number of DRIPc peaks in the sense and antisense orientations relative to gene transcription. (F) R-loops were measured by DRIP-qPCR at a number of loci through a time course post DRB treatment and wash (5’ indicates promoters; 3’ indicates terminators). The initial DRIP-qPCR value for each locus prior DRB treatment (time zero) was normalized to 100%. Bars represent the average of two independent experiments with standard error.
Figure 2
Figure 2. Prevalent R-loop formation
(A, B, C, D) Left panel: Metaplot of DRIPc signal centered on TSS (A, B) or PAS (C, D). Red: + strand signal; blue: - strand signal. All genes oriented to the right. Green: average GC skew for corresponding genes. Right panel: Representative screenshots for each gene class. (A) All R-loop forming TSSs. (B) Bidirectional R-loop forming TSSs. (C) All R-loop forming terminators. (D) R-loop forming colliding terminators. (E) Pie chart indicating the fraction of genes (in %) carrying gene body R-loop signal (in % gene body covered by signal grouped by decile). (F) Length and expression characteristics of “sticky” genes versus “normal” R-loop forming genes. (G) Representative screenshot of a “sticky” gene, BRD3. GC skew is indicated as red (positive skew) and blue (negative skew) blocks.
Figure 3
Figure 3. R-loop conservation
(A) Top: Circos plot depicting DRIP signal (red = high, green = low) along human chromosome 14 in 1 Mb bins for human Ntera2 (NT2), K562, and fibroblasts (Fibro) as well as murine E14 and NIH3T3 (3T3). Regions from mouse chromosome 14 and 12 syntenic to human chromosome 14 are connected by ribbons. Bottom: zoomed-in region; genes are indicated below. (B) Human v. mouse Pearson correlation of DRIP signal over orthologous genes (left) and 1 kb genomic tiles (right). (C) Conservation of R-loop signal between mouse and human cell lines broken down by gene parts. (D) Sequence conservation over genic regions for R-loop (+) (orange) and (−) (blue) loci matched for expression. P-values (Wilcoxon Mann-Whitney one-tailed) indicate significance.
Figure 4
Figure 4. R-loop forming regions are associated with open chromatin and high RNA polymerase occupancy
All metaplots are centered over R-loop peaks. R-loop (+) and R-loop (−) represent loci with and without R-loops, respectively. R-loop (+) and (−) genes were matched for expression and grouped into four expression quartiles (see inset in DRIPc metaplot). Metaplots of DNase, MNase, FAIRE, and DRIPc signal are arranged top to bottom and further broken by promoter, gene body, and terminal regions from left to right. The horizontal boxplots at the bottom of the promoter and terminal columns indicate the positions of TSS and TTS, respectively. Lines indicate the median value of signal at each position; the 95% confidence interval is shaded.
Figure 5
Figure 5. R-loop forming promoters associate with specific histone marks, chromatin binding factors, and DNA hypomethylation
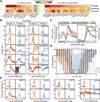
(A) Heatmap showing chromatin marks and chromatin binding factors enrichment or depletion over R-loop regions (promoter, gene body and terminal) relative to shuffled regions. Grey indicates effect size less than 5%. NS: not significant; other differences show p< 0.05 (Monte Carlo). (B) Metaplots of ChIP-seq signal for H3K4me1/2/3, H3K9ac, H3K27ac, H3K36me3, H3K9me3, H3.3 and PRO-seq with DRIPc signal at promoters. Colors and organization is as described for Figure 4. (C) Overlay of H3K4me1 (left) and H3K36me3 (right) ChIP-seq over DRIPc signal. ChIP-seq signal is broken down between R-loop (+) genes (red) and expression-matched R-loop (−) genes (blue); highly expressed genes (Q4) are shown. Green lines represent DRIPc signal for R-loop (+) (solid line) and R-loop (−) (dotted line) Q4 genes; 95% confidence intervals are shaded. (D) Boxplot of DNA methylation over a TSS-centered 4 kb region (low expression quartile, Q1, is shown). Each boxplot pair corresponds to a 200 bp window over R-loop (+) (orange) and expression-matched R-loop (−) (blue) promoters; median is shown by a black line. For each window, p-values indicate the significance of any difference between R-loop (+) and (−). Dotted lines indicate average DNA methylation values over the entire region. (E) Metaplots of ChIP-seq signal for RBPP5, PAF1, HDAC2, SIN3A, SAP30, PHF8, KDM4A, and ZNF274 with DRIPc signal.
Figure 6
Figure 6. R-loop forming terminators are associated with enhancer and insulator-like state and show characteristics of transcription terminators
(A) Metaplots of ChIP-seq signal for H3K4me1, p300, with DRIPc signal over terminal R-loop regions. The plots are centered on terminal R-loop peaks. Color code is as described for Figure 4. (B) Same as (A) except CTCF, RAD21 and ZNF143 were analyzed. (C) Same as (A) except PAF1, PRO-seq and H3K36me3 were analyzed. (D) Overlay of PRO-seq (left) and H3K36me3 ChIP-seq (right) over highly expressed (Q4) terminal DRIPc signal for R-loop (+) (red) and R-loop (−) genes. See Figure 5C for color codes. (E) Nearest neighbor gene distances for expressed (>Q1) colliding gene neighbors where none, one, or two of the neighbors form terminal R-loops. P-values were determined by a Wilcoxon Mann-Whitney test.
Figure 7
Figure 7. the position of the R-loop signal correlates with the position of transcription termination
(A) Metaplots of DRIPc, PRO-seq, H3K36me3, and PAF1 signals over terminal R-loop (+) genes (Q4). In each case, the signal is centered on PAS and broken down between early (n= 2,095), middle (n= 4280), and late-forming (n= 1126) R-loop (+) genes. Lines represent median values; 95% confidence intervals are shown. For PAF1, signal intensities were normalized and reported as percent maximal signal to better define the positional features. (B) Distribution of distances between the PAS site and the transcription termination points of individual genes as a function of R-loop signal position arranged in 1 kb bins around the PAS. The boxplots include all genes and a median trend line is shown. Data was calculated from PRO-seq data (K562). Genes with no terminal R-loops are shown at right.

References

    1. Aguilera A, Garcia-Muse T. R loops: from transcription byproducts to threats to genome stability. Molecular cell. 2012;46:115–124. - PubMed
    1. Bell AC, West AG, Felsenfeld G. The protein CTCF is required for the enhancer blocking activity of vertebrate insulators. Cell. 1999;98:387–396. - PubMed
    1. Belotserkovskii BP, Hanawalt PC. Anchoring nascent RNA to the DNA template could interfere with transcription. Biophys J. 2011;100:675–684. - PMC - PubMed
    1. Boguslawski SJ, Smith DE, Michalak MA, Mickelson KE, Yehle CO, Patterson WL, Carrico RJ. Characterization of monoclonal antibody to DNA.RNA and its application to immunodetection of hybrids. J Immunol Methods. 1986;89:123–130. - PubMed
    1. Boque-Sastre R, Soler M, Oliveira-Mateos C, Portela A, Moutinho C, Sayols S, Villanueva A, Esteller M, Guil S. Head-to-head antisense transcription and R-loop formation promotes transcriptional activation. Proc Natl Acad Sci U S A. 2015;112:5785–5790. - PMC - PubMed

Publication types

MeSH terms