Pharmacokinetic models of morphine and its metabolites in neonates:: Systematic comparisons of models from the literature, and development of a new meta-model
- PMID: 27373670
- PMCID: PMC4984529
- DOI: 10.1016/j.ejps.2016.06.026
Pharmacokinetic models of morphine and its metabolites in neonates:: Systematic comparisons of models from the literature, and development of a new meta-model
Abstract
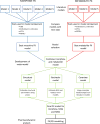
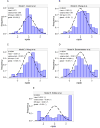
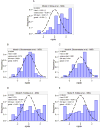
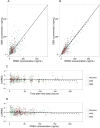
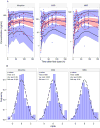
Morphine is commonly used for pain management in preterm neonates. The aims of this study were to compare published models of neonatal pharmacokinetics of morphine and its metabolites with a new dataset, and to combine the characteristics of the best predictive models to design a meta-model for morphine and its metabolites in preterm neonates. Moreover, the concentration-analgesia relationship for morphine in this clinical setting was also investigated. A population of 30 preterm neonates (gestational age: 23-32weeks) received a loading dose of morphine (50-100μg/kg), followed by a continuous infusion (5-10μg/kg/h) until analgesia was no longer required. Pain was assessed using the Premature Infant Pain Profile. Five published population models were compared using numerical and graphical tests of goodness-of-fit and predictive performance. Population modelling was conducted using NONMEM® and the $PRIOR subroutine to describe the time-course of plasma concentrations of morphine, morphine-3-glucuronide, and morphine-6-glucuronide, and the concentration-analgesia relationship for morphine. No published model adequately described morphine concentrations in this new dataset. Previously published population pharmacokinetic models of morphine, morphine-3-glucuronide, and morphine-6-glucuronide were combined into a meta-model. The meta-model provided an adequate description of the time-course of morphine and the concentrations of its metabolites in preterm neonates. Allometric weight scaling was applied to all clearance and volume terms. Maturation of morphine clearance was described as a function of postmenstrual age, while maturation of metabolite elimination was described as a function of postnatal age. A clear relationship between morphine concentrations and pain score was not established.
Keywords: Modelling; Morphine; Morphine-6-glucuronide; Pharmacokinetics/pharmacodynamics; Preterm neonates; Systematic model comparison.
Copyright © 2016 Elsevier B.V. All rights reserved.
Figures


Similar articles
-
Morphine pharmacokinetics and pharmacodynamics in preterm and term neonates: secondary results from the NEOPAIN trial.Br J Anaesth. 2008 Nov;101(5):680-9. doi: 10.1093/bja/aen248. Epub 2008 Aug 23. Br J Anaesth. 2008. PMID: 18723857 Free PMC article. Clinical Trial.
-
Morphine does not provide adequate analgesia for acute procedural pain among preterm neonates.Pediatrics. 2005 Jun;115(6):1494-500. doi: 10.1542/peds.2004-1425. Pediatrics. 2005. PMID: 15930209 Clinical Trial.
-
Developmental pharmacokinetics of morphine and its metabolites in neonates, infants and young children.Br J Anaesth. 2004 Feb;92(2):208-17. doi: 10.1093/bja/aeh042. Br J Anaesth. 2004. PMID: 14722170 Clinical Trial.
-
A review of morphine and morphine-6-glucuronide's pharmacokinetic-pharmacodynamic relationships in experimental and clinical pain.Eur J Pharm Sci. 2015 Jul 10;74:45-62. doi: 10.1016/j.ejps.2015.03.020. Epub 2015 Apr 7. Eur J Pharm Sci. 2015. PMID: 25861720 Review.
-
Recommended use of morphine in neonates, infants and children based on a literature review: Part 1--Pharmacokinetics.Paediatr Anaesth. 1997;7(1):5-11. doi: 10.1046/j.1460-9592.1997.d01-30.x. Paediatr Anaesth. 1997. PMID: 9041568 Review.
Cited by
-
Prior information for population pharmacokinetic and pharmacokinetic/pharmacodynamic analysis: overview and guidance with a focus on the NONMEM PRIOR subroutine.J Pharmacokinet Pharmacodyn. 2020 Oct;47(5):431-446. doi: 10.1007/s10928-020-09695-z. Epub 2020 Jun 13. J Pharmacokinet Pharmacodyn. 2020. PMID: 32535847 Free PMC article. Review.
-
Population Pharmacokinetic Model of Adalimumab Based on Prior Information Using Real World Data.Biomedicines. 2023 Oct 18;11(10):2822. doi: 10.3390/biomedicines11102822. Biomedicines. 2023. PMID: 37893195 Free PMC article.
-
Population pharmacokinetics of clofarabine for allogeneic hematopoietic cell transplantation in paediatric patients.Br J Clin Pharmacol. 2021 Aug;87(8):3218-3226. doi: 10.1111/bcp.14738. Epub 2021 Feb 1. Br J Clin Pharmacol. 2021. PMID: 33444472 Free PMC article.
-
Palbociclib exposure in relation to efficacy and toxicity in patients with advanced breast cancer.ESMO Open. 2025 Mar;10(3):104290. doi: 10.1016/j.esmoop.2025.104290. Epub 2025 Feb 15. ESMO Open. 2025. PMID: 39954390 Free PMC article. Clinical Trial.
-
Toward personalized medicine for pharmacological interventions in neonates using vital signs.Paediatr Neonatal Pain. 2021 Nov 22;3(4):147-155. doi: 10.1002/pne2.12065. eCollection 2021 Dec. Paediatr Neonatal Pain. 2021. PMID: 35372840 Free PMC article. Review.
References
-
- Alcorn J, McNamara PJ. Ontogeny of hepatic and renal systemic clearance pathways in infants: part I. Clinical pharmacokinetics. 2002;41:959–998. - PubMed
-
- Allegaert K, Peeters MY, Verbesselt R, Tibboel D, Naulaers G, de Hoon JN, Knibbe CA. Inter-individual variability in propofol pharmacokinetics in preterm and term neonates. British journal of anaesthesia. 2007;99:864–870. - PubMed
-
- Anderson BJ, van den Anker J. Why is there no morphine concentration-response curve for acute pain? Paediatric anaesthesia. 2014;24:233–238. - PubMed
Publication types
MeSH terms
Substances
Grants and funding
LinkOut - more resources
Full Text Sources
Other Literature Sources

