. 2016 Jul 20;91(2):356-69.
doi: 10.1016/j.neuron.2016.06.013. Epub 2016 Jun 30.

SRGAP2 and Its Human-Specific Paralog Co-Regulate the Development of Excitatory and Inhibitory Synapses

Affiliations

SRGAP2 and Its Human-Specific Paralog Co-Regulate the Development of Excitatory and Inhibitory Synapses

Matteo Fossati et al. Neuron. .

Abstract

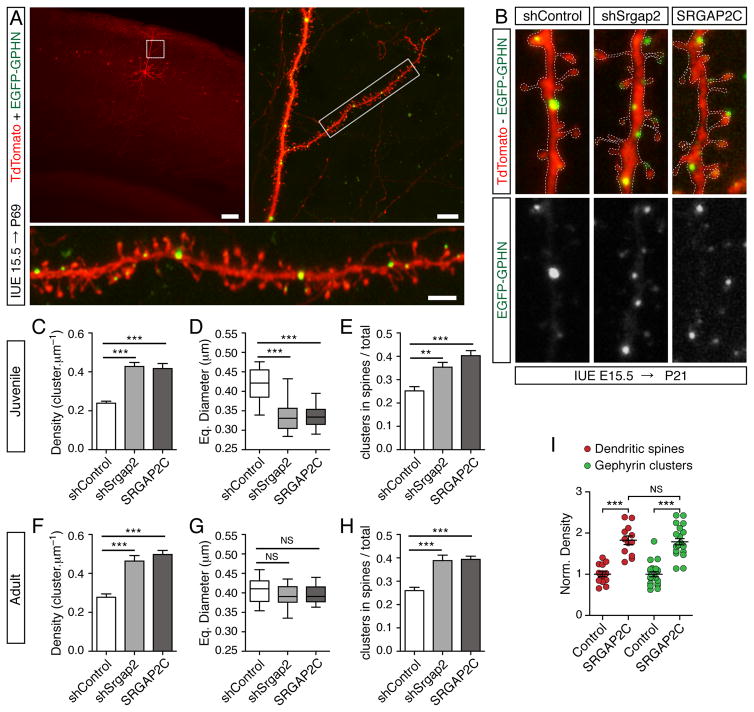
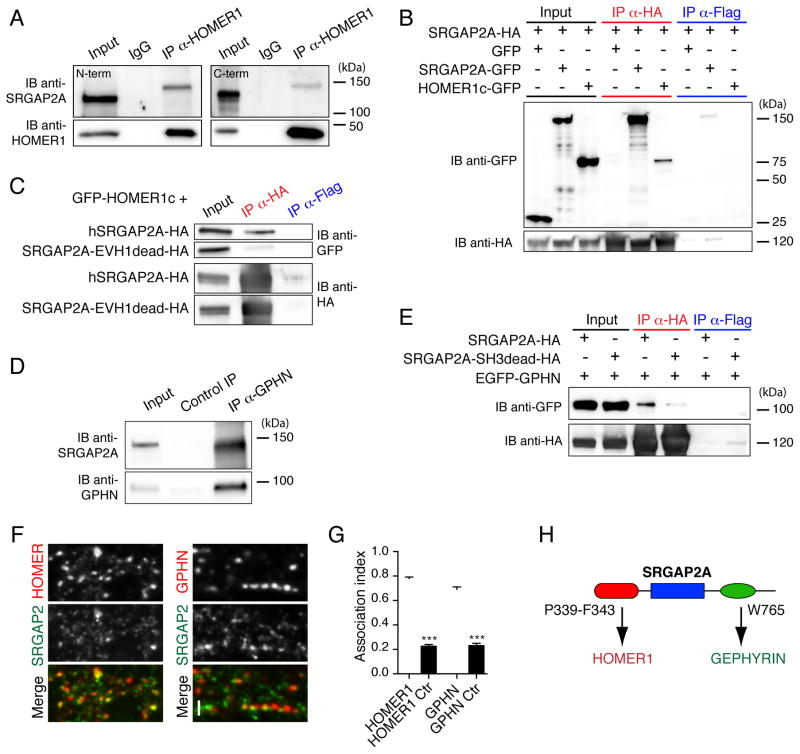
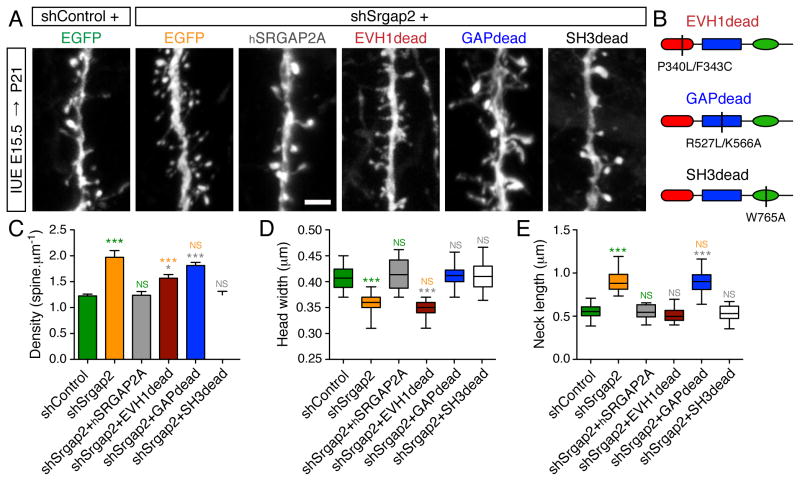
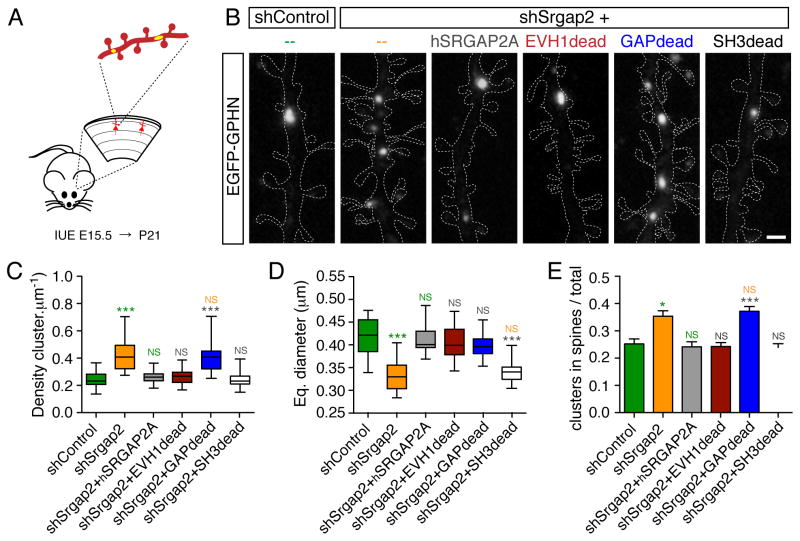
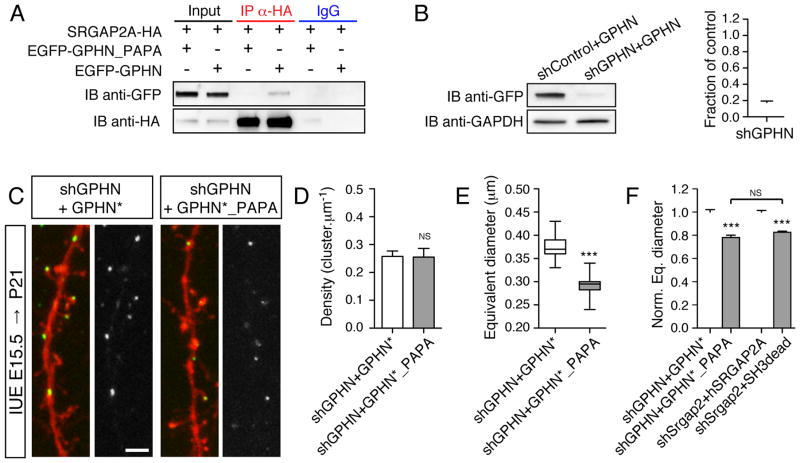
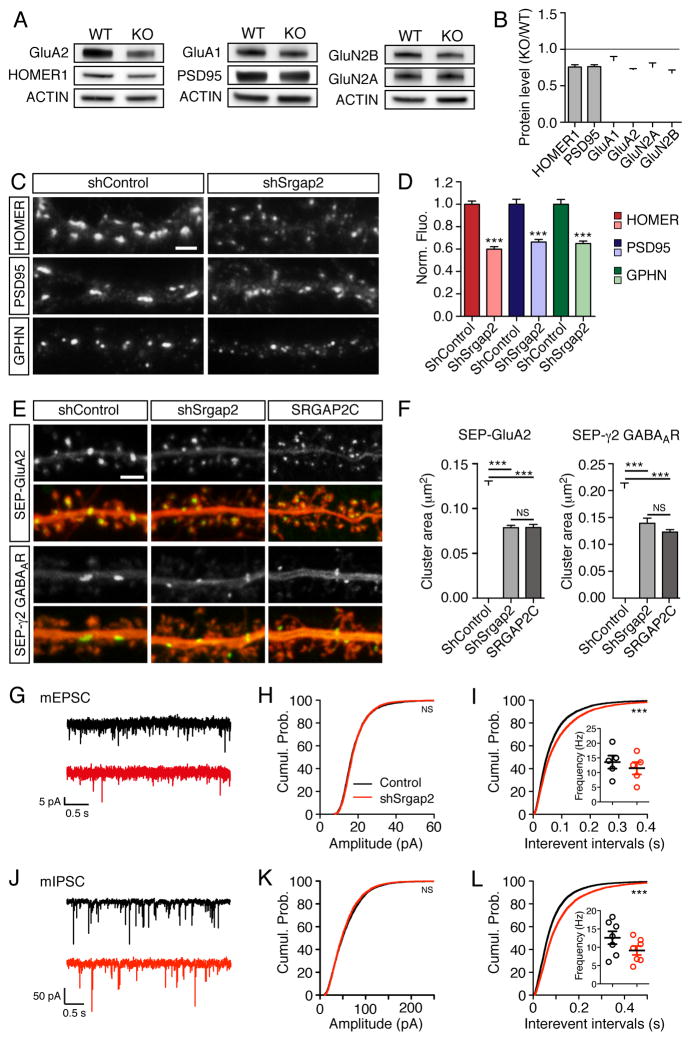
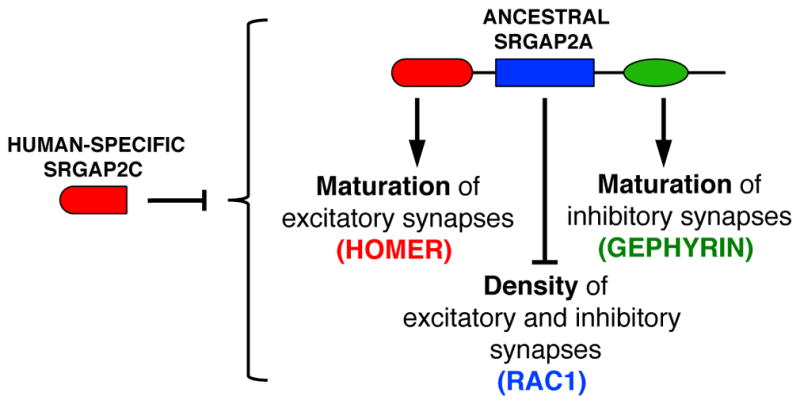
The proper function of neural circuits requires spatially and temporally balanced development of excitatory and inhibitory synapses. However, the molecular mechanisms coordinating excitatory and inhibitory synaptogenesis remain unknown. Here we demonstrate that SRGAP2A and its human-specific paralog SRGAP2C co-regulate the development of excitatory and inhibitory synapses in cortical pyramidal neurons in vivo. SRGAP2A promotes synaptic maturation, and ultimately the synaptic accumulation of AMPA and GABAA receptors, by interacting with key components of both excitatory and inhibitory postsynaptic scaffolds, Homer and Gephyrin. Furthermore, SRGAP2A limits the density of both types of synapses via its Rac1-GAP activity. SRGAP2C inhibits all identified functions of SRGAP2A, protracting the maturation and increasing the density of excitatory and inhibitory synapses. Our results uncover a molecular mechanism coordinating critical features of synaptic development and suggest that human-specific duplication of SRGAP2 might have contributed to the emergence of unique traits of human neurons while preserving the excitation/inhibition balance.


Figures

Figure 1
Figure 1. SRGAP2A and its human-specific paralog SRGAP2C regulate the maturation and the density of inhibitory synapses in vivo
(A) Visualization of inhibitory synapses in sparse layer 2/3 cortical pyramidal neurons after in utero electroporation (IUE) with soluble TdTomato (red) and EGFP-Gephyrin (EGFP-GPHN, green). Inhibitory synapses in oblique apical dendrites (insets) are located in the dendritic shaft (large arrowheads) or directly in dendritic spines (small arrowheads). P69: postnatal day 69, shSrgap2: shRNA targeting mouse Srgap2a. Scale bars: 100 μm (top left), 10 μm (top right and bottom panels). (B) Segments of dendrites from layer 2/3 pyramidal neurons expressing a control shRNA (shControl), shSrgap2 or SRGAP2C along with EGFP-Gephyrin in juvenile mice (P21). The dashed lines indicate the contour of dendrites (from TdTomato). Arrowheads point to examples of Gephyrin clusters in spines. Scale bar: 1 μm. (C–H) Quantifications of Gephyrin cluster density (C, F), equivalent (Eq.) diameter (D, G), and proportion of Gephyrin clusters located in spines (E, H) in juveniles (C–E) and adult mice (F–H). Juveniles: nshControl = 32, nshSrgap2 = 36, nSRGAP2C = 31. Adults: nshControl = 21, nshSrgap2 = 23, nSRGAP2C = 22. Mean ± SEM in C, E, F, H. Box plot showing the distribution of the mean value per cell in D and G. *** p < 0.001, ** p < 0.01, NS (Not Significant): p > 0.05, Kruskal-Wallis test followed by Dunn’s Multiple comparison test. (I) Similar effects of SRGAP2C expression on the density of dendritic spines (red) and Gephyrin clusters (green) in adult cortical neurons (P>65). Norm. density: normalized density. Spines (data from Charrier et al., 2012): nControl = 14 and nSRGAP2C = 12. Gephyrin: same as in h. *** p < 0.001, NS: p > 0.05, Mann Whitney test. See also Figure S1 and S2.
Figure 2
Figure 2. SRGAP2A interacts with Homer1 and Gephyrin
(A) Co-immunoprecipitation (Co-IP) of endogenous SRGAP2A and Homer1 in synaptic fractions from P15 mouse brains. SRGAP2A was co-immunoprecipitated using anti-Homer1 antibody and detected in Western blot using two specific antibodies directed against its N-terminal domain (left) and its C-terminal domain (right). IB: immunoblot, α: anti. (B) Co-IP of SRGAP2A-HA and GFP-HOMER1c in HEK cells. (C) Mutation of the class 2 EVH1 binding motif of SRGAP2A (P340L/F343C, EVH1dead mutant) disrupts its interaction with HOMER1c in HEK cells. (D) Co-IP of endogenous SRGAP2A and Gephyrin (GPHN) in synaptic fractions isolated from P15 mouse brains using GPHN.FingR. (E) SRGAP2A interacts with EGFP-GPHN via its SH3 domain in HEK cells. SRGAP2A SH3dead mutant contains a W765A point mutation. (F) Single section confocal images of endogenous SRGAP2A with Homer1 or GPHN in dissociated mouse cortical neurons after 17 days in vitro reveal close association (arrowheads) between SRGAP2A and both excitatory and inhibitory synapses. Scale bar: 2 μm. (G) Histogram showing the fraction of Homer1 and gephyrin clusters associated with SRGAP2A immunoreactivity (association index). The control (Ctr) values correspond to the random fraction of Homer1 and gephyrin clusters associated with SRGAP2A in mismatched images. HOMER1 and HOMER1 Ctr: n = 21, GPHN and GPHN Ctr: n = 23. Mean ± SEM. *** p < 0.001, Mann-Whitney test. (H) Schematic of SRGAP2A interactions with Homer and Gephyrin. See also Figures S3 and S4.
Figure 3
Figure 3. Molecular dissection of SRGAP2A function in spine development in vivo.
(A) Representative segments of oblique dendrites expressing mVenus from P21 mice in control condition (shControl), after knock-down of mouse Srgap2a (shSrgap2), replacement with hSRGAP2A or replacement with the indicated mutants in layer 2/3 cortical neurons using IUE. Scale bar: 2 μm. (B) Schematic of hSRGAP2A mutants used in (A). (C) Mean spine density (± SEM). (D) Quantification of spine head widths. (E) Quantification of spine neck lengths. nshControl = 19, nshSrgap2 = 20, nshSrgap2+hSRGAP2A = 18, nshSrgap2+EVH1dead = 24, nshSrgap2+GAPdead = 25, nshSrgap2+SH3dead = 23. *** p < 0.001, * p < 0.05, NS: p > 0.05, Kruskal-Wallis test followed by Dunn’s Multiple comparison test. Green, orange, grey and blue symbols: comparison with shControl, shSrgap2, shSrgap2+hSRGAP2A, shSrgap2+GAPdead, respectively. See also Figures S2, S5 and S6.
Figure 4
Figure 4. Molecular dissection of SRGAP2A function in inhibitory synaptic development in vivo.
(A) Schematic: segments of oblique dendrites of layer 2/3 cortical pyramidal neurons were imaged from P21 mice following sparse IUE. EGFP-Gephyrin (yellow) labels inhibitory synapses, TdTomato (red) allows the visualization of dendritic morphology. (B) EGFP-Gephyrin clusters in representative segments of dendrites in control condition (shControl) or after in utero replacement of mouse Srgap2a with indicated mutants of hSRGAP2A. For clarity, dashed lines define the contours of TdTomato fluorescence in dendrites. Scale bar: 1 μm. (C–E) Quantification of Gephyrin cluster density (C), Gephyrin cluster equivalent (Eq.) diameter (D) and mean proportion of Gephyrin clusters located in dendritic spines (± SEM) (E). nshControl = 32, nshSrgap2 = 36, nshSrgap2+hSRGAP2A = 31, nshSrgap2+EVH1dead = 30, nshSrgap2+GAPdead = 32, nshSrgap2+SH3dead = 31. *** p < 0.001, * p < 0.05, NS: p > 0.05, Kruskal-Wallis test followed by Dunn’s Multiple comparison test. Green, Orange, grey: comparison with shControl, shSrgap2 and shSrgap2+hSRGAP2A, respectively. See also Figure S6
Figure 5
Figure 5. Specific interaction between SRGAP2A and Gephyrin promotes inhibitory synapse maturation
(A) Mutation of the binding site of SRGAP2A on Gephyrin (P603A/P606A, named GPHN_PAPA mutant) disrupted the interaction between SRGAP2A and Gephyrin in co-IP experiment in HEK cells. (B) Validation of shGPHN in HEK cells using Western blot (left) and quantification. n = 3, mean ± SEM. (C) Representative segments of dendrites from P21 mice after in utero replacement of endogenous Gephyrin with EGFP-tagged GPHN* or GPHN*_PAPA (green), and co-expression of soluble TdTomato (red). Scale bar 2 μm. (D–E) Quantification of gephyrin cluster density (D) and equivalent diameter (E). nshGPHN+GPHN* = 15 (from 3 mice), n shGPHN+GPHN*_PAPA = 15 (from 4 mices), *** p < 0.001, NS: p > 0.05, Mann-Whitney test. (F) Replacement of endogenous GPHN with GPHN*_PAPA mutant and replacement of endogenous SRGAP2A with hSRGAP2A SH3dead mutant have similar effects. The equivalent (eq.) diameter was normalized to the average value in shGPHN+GPHN* and shSrgap2+hSRGAP2A, respectively. *** p < 0.001, NS: p > 0.05, Kruskal-Wallis test, followed by Dunn’s Multiple comparison test.
Figure 6
Figure 6. SRGAP2A regulates the assembly of excitatory and inhibitory postsynaptic scaffolds
(A–B) Representative Western blots (A) and quantifications (B) of the synaptic abundance of the indicated proteins in P15 wild-type (WT) and Srgap2a KO brains (n=4). (C) Immunofluorescence of endogenous proteins in cortical neurons cultured for 17–18 days in control condition (shControl) or after Srgap2a knock-down (shSrgap2). Scale bar 2 μm. (D) Normalized fluorescence intensity (Norm. Fluo.) associated with clusters of the indicated proteins in shControl and shSrgap2 conditions (n=40–42 cells). (E) Live imaging of SEP-GluA2 and SEP-γ2 GABAA receptors in control pyramidal neurons, after Srgap2a knock-kown or after SRGAP2C expression (20–22 days in vitro). Scale bar: 2 μm. (F) Mean receptor cluster size in the conditions described above. SEP-GluA2: nshControl = 34, nshSrgap2 = 35, nSRGAP2C = 32 ; SEP-γ2: nshControl = 36, nshSrgap2 = 25, nSRGAP2C = 35. Mean ± SEM. (G) Representative traces of mEPSCs in control (black) and shSrgap2-electroporated (red) neurons. (H–I) Quantification of mEPSC amplitude (nControl = 2883 from 5 cells, nshSrgap2 = 2811 from 5 cells) and interevent intervals (nControl = 7232, nshSrgap2 = 6587). Cumul. Prob.: cumulative probability. Inset indicates the mean frequency per cell. (J) Representative traces of mIPSCs in control (black) and shSrgap2-electroporated (red) neurons. (K–L) Quantification of mIPSC amplitude (nControl = 4370 from 7 cells, nshSrgap2 = 4125 from 7 cells) and interevent intervals (nControl = 11520, nshSrgap2 = 8262). Inset indicates the mean frequency per cell. *** p < 0.001, NS: p > 0.05, Mann-Whitney test or Kruskal-Wallis test followed by Dunn’s multiple comparison test (panel F).
Figure 7
Figure 7. Summary of the mechanism underlying the coordination of excitatory and inhibitory synaptic development by SRGAP2 paralogs
See text for details.

Comment in

References

    1. Alvarez VA, Sabatini BL. Anatomical and physiological plasticity of dendritic spines. Annu Rev Neurosci. 2007;30:79–97. - PubMed
    1. Araya R, Vogels TP, Yuste R. Activity-dependent dendritic spine neck changes are correlated with synaptic strength. Proc Natl Acad Sci U S A. 2006;111:2895–2904. - PMC - PubMed
    1. Bayes A, Collins MO, Croning MD, van de Lagemaat LN, Choudhary JS, Grant SG. Comparative study of human and mouse postsynaptic proteomes finds high compositional conservation and abundance differences for key synaptic proteins. PLoS One. 2012;7:e46683. - PMC - PubMed
    1. Benavides-Piccione R, Ballesteros-Yanez I, DeFelipe J, Yuste R. Cortical area and species differences in dendritic spine morphology. J Neurocytol. 2002;31:337–346. - PubMed
    1. Benson DL, Cohen PA. Activity-independent segregation of excitatory and inhibitory synaptic terminals in cultured hippocampal neurons. J Neurosci. 1996;16:6424–6432. - PMC - PubMed

Publication types

MeSH terms