. 2016 Jul:9:61-76.
doi: 10.1016/j.ebiom.2016.06.017. Epub 2016 Jun 15.

Activation of PPARγ by a Natural Flavonoid Modulator, Apigenin Ameliorates Obesity-Related Inflammation Via Regulation of Macrophage Polarization

Affiliations

Activation of PPARγ by a Natural Flavonoid Modulator, Apigenin Ameliorates Obesity-Related Inflammation Via Regulation of Macrophage Polarization

Xiujing Feng et al. EBioMedicine. 2016 Jul.

Abstract

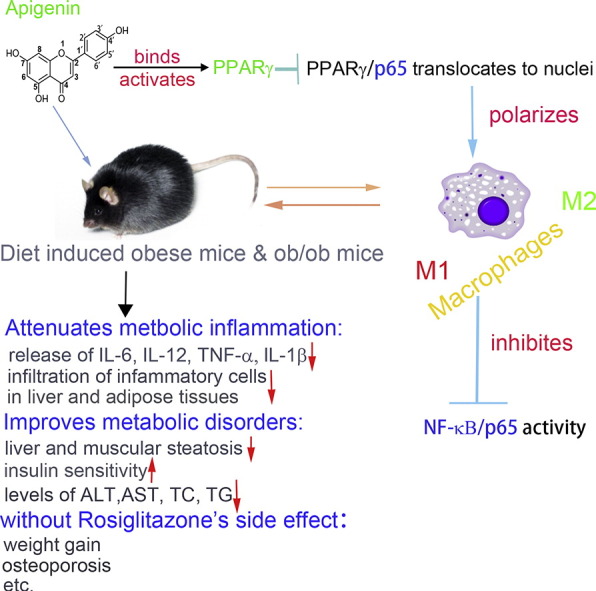
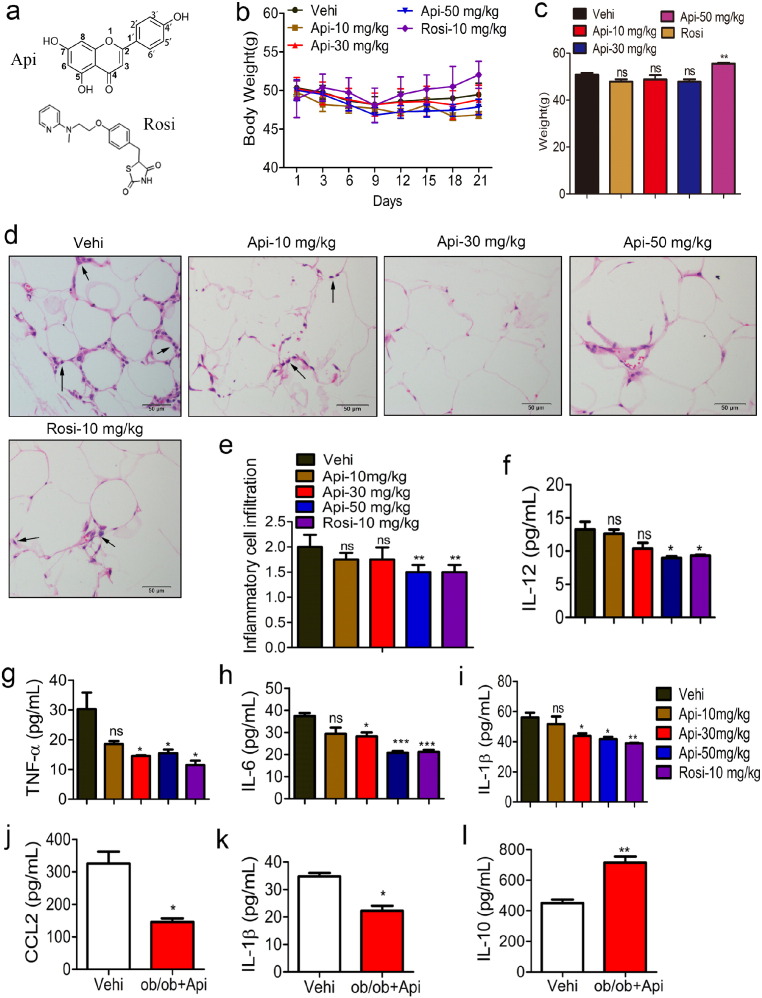
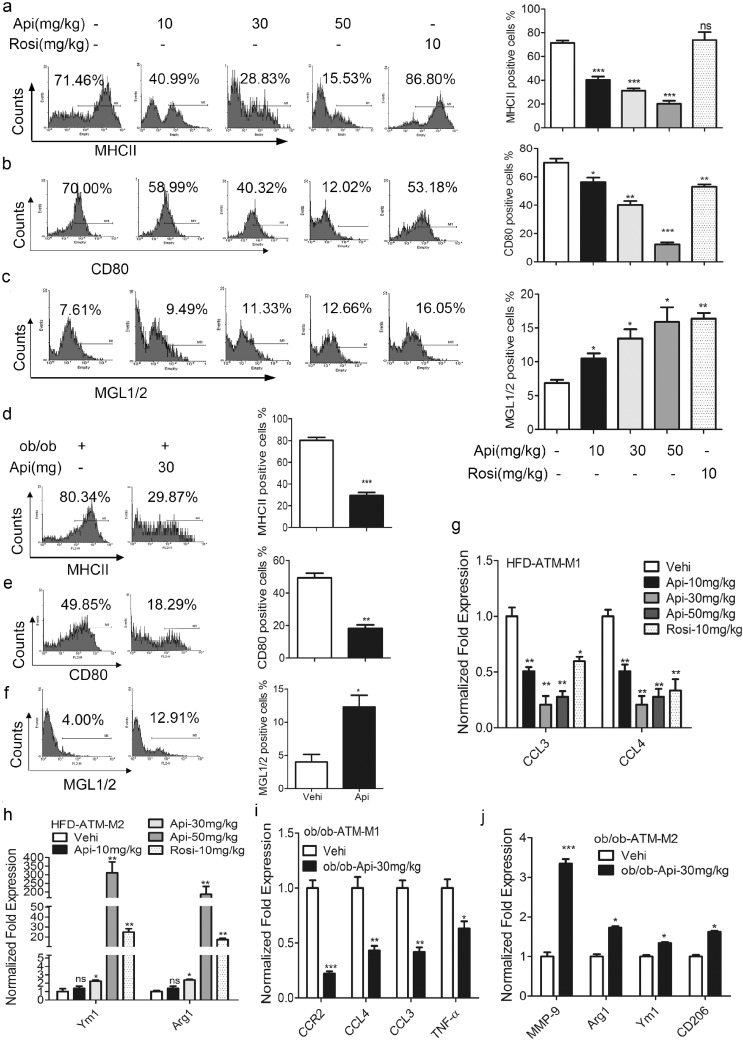
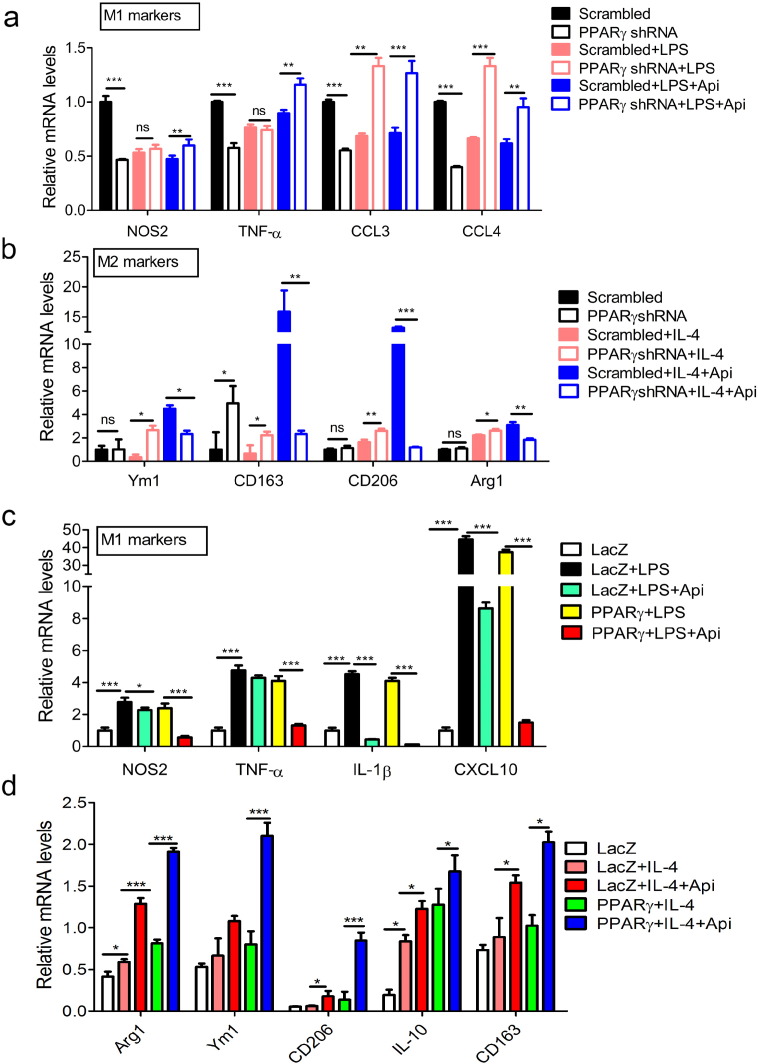
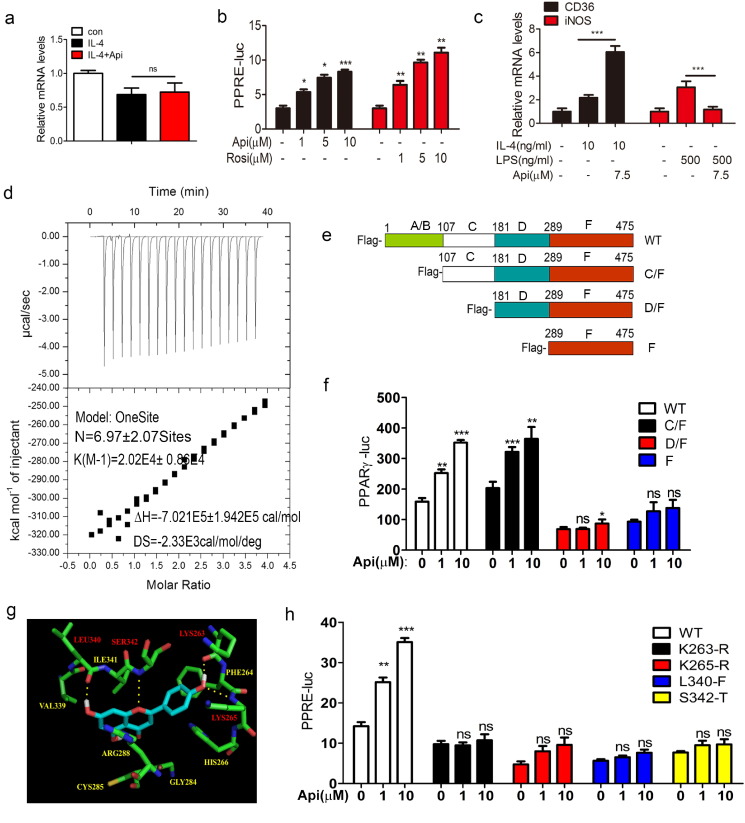
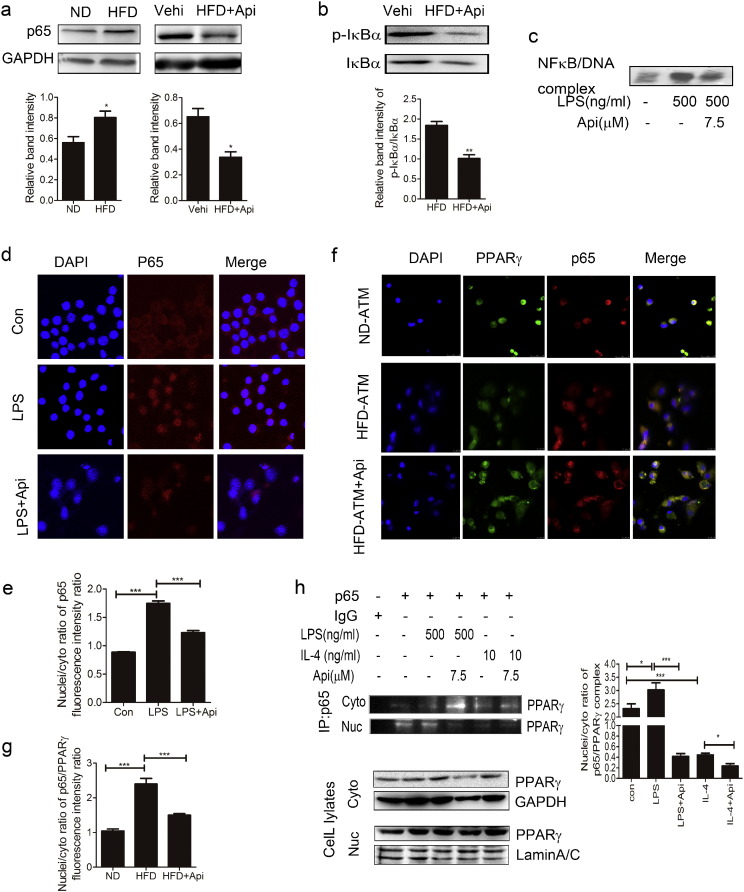
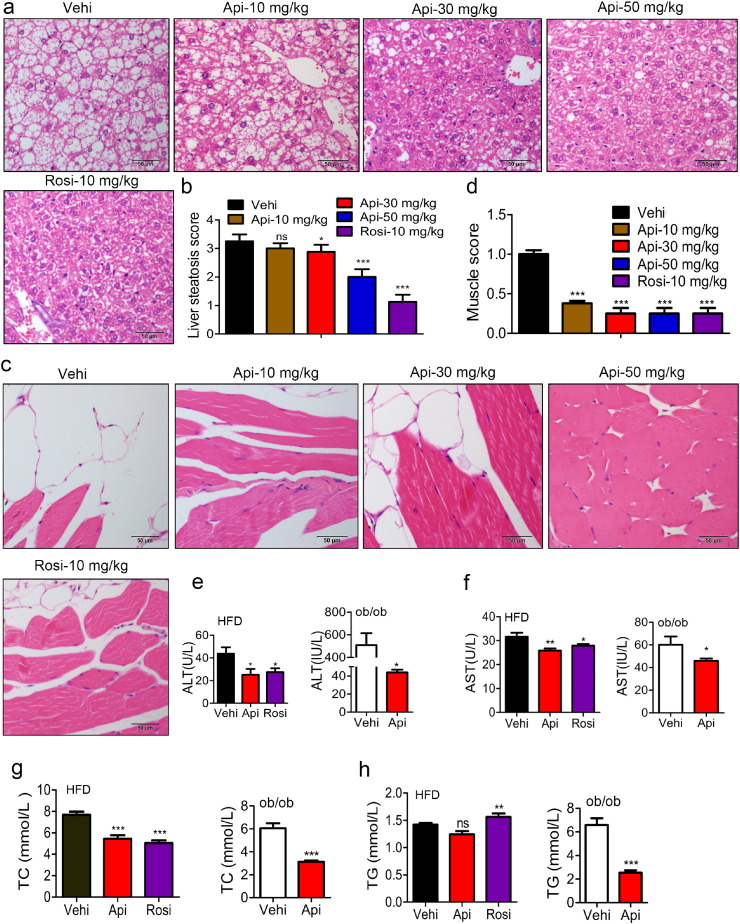
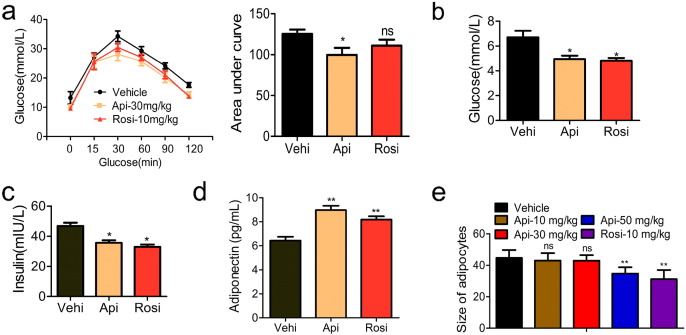
PPARγ has emerged as a master regulator of macrophage polarization and is the molecular target of the thiazolidinedione drugs. Here we show that apigenin binds and activates PPARγ by acting as a modulator. Activation of PPARγ by apigenin blocks p65 translocation into nuclei through inhibition of p65/PPARγ complex translocation into nuclei, thereby decreasing NF-κB activation and favoringM2 macrophage polarization. In HFD and ob/ob mice, apigenin significantly reverses M1 macrophage into M2 and reduces the infiltration of inflammatory cells in liver and adipose tissues, as well as decreases the levels of pro-inflammatory cytokines, thereby alleviating inflammation. Strikingly, apigenin reduces liver and muscular steatosis, decreases the levels of ALT, AST, TC and TG, improving glucose resistance obviously. Unlike rosiglitazone, apigenin does not cause significant weight gain, osteoporosis et al. Our findings identify apigenin as a modulator of PPARγ and a potential lead compound for treatment of metabolic disorders.

Keywords: Apigenin; Macrophage polarization; NF-κB; Obesity-related inflammation; PPARγ.


Figures

Image 1
Graphical abstract
Fig. 1
Fig. 1
Api attenuates obesity-related inflammation. (a) The chemical structure of Api and Rosi. (b–c) HFD-fed mice treated with the vehicle (0.1% DMSO), indicated doses of Api for 21 days, the effects of Api or Rosi on body weight and the statistical analysis at 21st day, (n = 9). All values are expressed as mean ± SEM. Statistical analysis is based on one-way ANOVA followed by a Dunnett's test. **P < 0.01 compared with vehicle. (d) Representative H&E staining showed adipose tissue morphology of the HFD-fed mice treated with the vehicle (0.1% DMSO), indicated doses of Api for 21 days, original magnification × 400, n = 6. Arrows indicated the inflammatory cells in adipose tissue (n = 9). (e) Quantification of the infiltration of inflammatory cells into adipose tissue from the HFD-fed mice treated with the vehicle (0.1% DMSO), indicated doses of Api for 21 days, for five to eight sections/400 × field, five to six fields/gland/mouse, score according to the grade of lesion, slight (0.5), mild (1), moderate (2), severe (3), profound severe (4) and normal (0), (n = 6). All values are expressed as mean ± SEM. Statistical analysis is based on one-way ANOVA followed by a Dunnett's test. **P < 0.01 compared with vehicle. (f–i) Inflammatory cytokine IL-12, TNF-α, IL-6 and IL-1β in the serum of HFD-fed mice treated with the vehicle (0.1% DMSO), indicated doses of Api for 21 days were measured by ELISA assays according to manufacturer's instructions (n = 9). All values are expressed as mean ± SEM. Statistical analysis is based on one-way ANOVA followed by a Dunnett's test. *P < 0.05, **P < 0.01, ***P < 0.001 compared with vehicle. (j–l) 3 month years old male ob/ob mice were injected vehicle (0.1% DMSO) or 30 mg/kg Api for 21 days, the CCL2, IL-1β and IL-10 in the serum were measured by ELISA assays according to manufacturer's instructions (n = 6). All values are expressed as mean ± SEM. Statistical analysis is based on the Student's t-test. *P < 0.05, **P < 0.01 compared with vehicle.
Fig. 2
Fig. 2
Api restores the M1/M2 status in obese mice. (a–c) The expression of surface markers MHCII, CD80 and MGL1/2 of mouse primary peritoneal macrophage isolated from HFD mice treated with the vehicle (0.1% DMSO), indicated doses of Api for 21 days was measured (left) and the flow data was quantified (right) by using on one-way ANOVA followed by a Dunnett's test (n = 9). All values are expressed as mean ± SEM. *P < 0.05, **P < 0.01, ***P < 0.001, ns, no significant difference compared with vehicle. (d–f) The expression of surface markers MHCII, CD80 and MGL1/2 of mouse primary peritoneal macrophage isolated from ob/ob mice treated with the vehicle (0.1% DMSO), 30 mg/kg Api for 21 days was measured (left) and the flow data was quantified (right) by using the Student's t-test (n = 9). All values are expressed as mean ± SEM. *P < 0.05, **P < 0.01, ***P < 0.001 compared with vehicle. (g–h) Relative mRNA expression of M1 and M2 macrophage markers in the adipose tissue macrophages (ATMs) from HFD mice treated with the vehicle (0.1% DMSO), indicated doses of Api for 21 days, CCL3, CCL4, Arg1 and Ym1 were measured by using qRT-PCR, and normalized to vehicle group and the level of β-actin. All values are expressed as mean ± SEM. Statistical analysis is based on one-way ANOVA followed by a Dunnett's test (n = 9). *P < 0.05, **P < 0.01, ***P < 0.001, ns, no significant difference, compared with vehicle. (i–j) Relative mRNA expression of M1 macrophage markers, CCR2, CCL3, CCL4, TNF-α and M2 markers MMP-9, Arg1, Ym1 and CD206 in the ATMs from ob/ob mice treated with the vehicle (0.1% DMSO), 30 mg/kg Api for 21 days were measured by using qRT-PCR, and normalized to ob/ob (vehicle) group and the level of β-actin (n = 9). All values are expressed as mean ± SEM. Statistical analysis is based on the Student's t-test. *P < 0.05, **P < 0.01, ***P < 0.001 compared with vehicle.
Fig. 3
Fig. 3
PPARγ is necessary for Api regulating M1/M2 status. (a) RAW264.7 cells transfected WT and PPARγ plasmids were treated with 500 ng/mL LPS or 500 ng/mL LPS + 7.5 μM Api simultaneously for 24 h, followed by qRT-PCR with indicated probes (below graphs). Data indicate fold induction (normalized by β-actin signal). All values are expressed as mean ± SEM. Statistical analysis is based on one-way ANOVA followed by a Dunnett's test. *P < 0.05, **P < 0.01, ***P < 0.001. (b) Cells in (a) were treated with 10 ng/mL IL-4 or 10 ng/mL IL-4 + 7.5 μM Api simultaneously for 24 h, and then subjected to qRT-PCR, the data analysis as (a). All values are expressed as mean ± SEM. Statistical analysis is based on one-way ANOVA followed by a Dunnett's test. *P < 0.05, **P < 0.01, ***P < 0.001. (c) RAW264.7 cells transfected scrambled or PPARγ shRNA were treated with 500 ng/mL LPS or 500 ng/mL LPS + 7.5 μM Api simultaneously for 24 h, followed by qRT-PCR with indicated probes (below graphs). Data indicate fold induction (normalized by β-actin signal). All values are expressed as mean ± SEM. Statistical analysis is based on one-way ANOVA followed by a Dunnett's test. *P < 0.05, **P < 0.01, ***P < 0.001. (d) Cells in (c) were treated with 10 ng/mL IL-4 or10 ng/mL IL-4 + 7.5 μM Api simultaneously for 24 h, then subjected to qRT-PCR, the data analysis as (c). All values are expressed as mean ± SEM. Statistical analysis is based on one-way ANOVA followed by a Dunnett's test. *P < 0.05, **P < 0.01, ***P < 0.001.
Fig. 4
Fig. 4
Api binds to and activates PPARγ. (a) ANA-1 macrophages was treated with 10 ng/mL IL-4 or 10 ng/mL IL-4 plus 7.5 μM Api simultaneously for 24 h, the mRNA level PPARγ was measured by using qRT-PCR. Data indicate fold induction (normalized by β-actin signal). All values are expressed as mean ± SEM. Statistical analysis is based on one-way ANOVA followed by a Dunnett's test. ns, no significant difference. (b) Transcriptional activation of PPARγ in cells treated with the indicated dosages of Api or Rosi. HER293T cells were transfected with pIRES-mPPARγ/PPRE and pRL-control using Lipofectamine2000. Then cells were pre-treated with apigenin for 24 h. Luciferase activities were measured by using the dual-luciferase reporter assay system. All values are expressed as mean ± SEM. Statistical analysis is based on one-way ANOVA followed by a Dunnett's test. *P < 0.05, **P < 0.01, ***P < 0.001 compared with 0 group. (c) ANA-1 macrophages was treated with the indicated group for 24 h, the mRNA level PPARγ activation related genes CD36 and iNOS was measured by using qRT-PCR. Data indicate fold induction (normalized by β-actin signal). All values are expressed as mean ± SEM. Statistical analysis is based on one-way ANOVA followed by a Dunnett's test. ns, no significant difference. (d) ITC data for binding of Api to PPARγ. The upper panels show the raw data, and the lower panels show the corresponding binding isotherm fitted according to the “one binding site” model. Reference titration of ligand into buffer was used to correct for heat of dilution. The thermodynamic parameters (K, ΔH, and ΔS) are indicated under the below. (e) The deletion mutant model. (f) HER293T cells were transfected with pIRES-mPPARγ truncated mutants/PPRE and pRL-control using Lipofectamine2000. Then cells were pre-treated with Api (1 μM, 10 μM) for 24 h. Luciferase activities were measured by using the dual-luciferase reporter assay system. All values are expressed as mean ± SEM. Statistical analysis is based on one-way ANOVA followed by a Dunnett's test. *P < 0.05, **P < 0.01, ***P < 0.001 compared with 0 group. (g) Auto dock model of Api binding to the PPARγ. Hydrogen bonding was built between Api and the Lys263, Lys265, Leu340 and Ser 342 sites of PPARγ. (h) Mutants disturbed Api from activating PPARγ analyzed using the dual-luciferase reporter assay system. HER293T cells were transfected with pIRES-mPPARγ point mutants/PPRE and pRL-control using Lipofectamine2000. Then cells were pre-treated with Api (1 μM, 10 μM) for 24 h. Luciferase activities were measured by using the dual-luciferase reporter assay system. All values are expressed as mean ± SEM. Statistical analysis is based on one-way ANOVA followed by a Dunnett's test. *P < 0.05, **P < 0.01, ***P < 0.001 compared with 0 group.
Fig. 5
Fig. 5
Api regulates macrophage polarization via inhibiting the interaction between p65 and PPARγ. (a)The expression of p65 in the primary peritoneal macrophages of 19 weeks ND and HFD mice treated with 30 mg/kg Api for 21 days was assayed by western blotting for three times, 3 mice/time (top). And the quantification of the protein level by using image J software (bottom). All values are expressed as mean ± SEM. Statistical analysis is based on the Student's t-test. *P < 0.05 compared with ND or vehicle. (b)The impact of Api on IκBα, p-IκBα abundance were evaluated in the primary peritoneal macrophages of mice treated for 21 days with 30 mg/kg Api by western blotting for three times, 3 mice/group (top). And the quantification of the protein level by image J software (bottom). All values are expressed as mean ± SEM. Statistical analysis is based on the Student's t-test. **P < 0.01 compared with vehicle group. (c) The effect of 7.5 μM Api in LPS-induced ANA-1 on the activities of p65 was detected by EMSA assay. Figure shows one image from at least three independent experiments. (d) Using immunofluorescence, the p65 was evaluated in macrophage treated with Control, LPS (500 ng/mL), or LPS (500 ng/mL) and 7.5 μM Api simultaneously for 24 h. p65 is shown in red, and nuclei stained with DAPI. Original magnification is × 400. Figure shows one image from at least three independent experiments. (e) The nuclei/cytoplasm ratio of (d) at least three independent experiments was quantified by Image J software. All values are expressed as mean ± SEM. Statistical analysis is based on one-way ANOVA followed by a Dunnett's test. ***P < 0.001 compared with con or LPS group. (f) The p65/PPARγ complex in the ATM of mice treated with 30 mg/kg Api for 21 days was assayed by confocal microscopy. p65 is shown in red, PPARγ is shown in green and nuclei stained with DAPI. Original magnification is × 400. (g) Data from (F) at least three independent experiments was quantified by Image J software. All values are expressed as mean ± SEM. Statistical analysis is based on one-way ANOVA followed by a Dunnett's test. ***P < 0.001 compared with ND or HFD. (h) ANA-1 macrophages were treated with 500 ng/mL LPS, 10 ng/mL IL-4, 500 ng/mL LPS plus 7.5 μM Api simultaneously or 10 ng/mL IL-4 plus 7.5 μM Api for 24 h. The nuclei and cytoplasm protein was lysed and subjected to immunoprecipitation and western blotting (left). Data from at least three independent experiments was quantified by Image J software (right). All values are expressed as mean ± SEM. Statistical analysis is based on one-way ANOVA followed by a Dunnett's test. *P < 0.05, ***P < 0.001. (For interpretation of the references to colour in this figure legend, the reader is referred to the web version of this article.)
Fig. 6
Fig. 6
Api attenuates the metabolic disorders of obese mice. (a-c) Representative H&E staining showed liver/muscular morphology from 16-week-old HFD mice (n = 9) treated with the vehicle indicated doses of Api for 21 days and (b–d) the Quantification of hepatic/muscular steatosis for five to eight sections/400 × field, five to six fields/gland/mouse, score according to the grade of lesion, slight (0.5), mild (1), moderate (2), severe (3), profound severe (4) and normal (0), n = 6, original magnification × 400. Statistical analysis is based on one-way ANOVA followed by a Dunnett's test. ***P < 0.001 compared with vehicle. (e–h) the activities of ALT (e) and AST (f), The levels of TC (G) and TG (H) in serum of HFD and ob/ob mice were significantly reduced by Api or Rosi, n = 9 or 6. All values are expressed as mean ± SEM. Statistical analysis is based on one-way ANOVA followed by a Dunnett's test or based on the Student's t-test for comparing two groups. ***P < 0.001 compared with vehicle.
Fig. 7
Fig. 7
Api treatment improves insulin sensitivity and glucose tolerance. (a) glucose tolerance tests and the total area under the curve (AUC) in HFD mice treated with vehicle, Api or rogiglatazone, n = 9. Statistical analysis is based on one-way ANOVA followed by a Dunnett's test. Ns, no significant difference, *p < 0.05 compared with vehicle group. (b) The levels of glucose and (c) insulin in the serum of HFD mice treated with vehicle, Api or rogiglatazone, n = 9. Statistical analysis is based on one-way ANOVA followed by a Dunnett's test. *p < 0.05 compared with vehicle group. (d) Adiponetin in the serum of mice was detected by ELISA, n = 9. Statistical analysis is based on one-way ANOVA followed by a Dunnett's test. **p < 0.01 compared with vehicle group. (e) The size of adipocyte was quantified by the microscope micrometers at the 100 × light microscope. Count the numbers of adipocytes in the measurement unit area (25 mm2), unit: numbers/25 mm2/100 ×, n = 6. All values are expressed as mean ± SEM. Statistical analysis is based on one-way ANOVA followed by a Dunnett's test. **p < 0.01 compared with vehicle group.

Similar articles

Cited by

References

    1. Arango D., Morohashi K., Yilmaz A., Kuramochi K., Parihar A., Brahimaj B., Grotewold E., Doseff A.I. Molecular basis for the action of a dietary flavonoid revealed by the comprehensive identification of apigenin human targets. Proc. Natl. Acad. Sci. U. S. A. 2013;110:E2153–E2162. - PMC - PubMed
    1. Audic S., Claverie J.M. The significance of digital gene expression profiles. Genome Res. 1997;7:986–995. - PubMed
    1. Bao X., Cui J., Wu Y., Han X., Gao C., Hua Z., Shen P. The roles of endogenous reactive oxygen species and nitric oxide in triptolide-induced apoptotic cell death in macrophages. J. Mol. Med. (Berl) 2007;85:85–98. - PubMed
    1. Bouhlel M.A., Derudas B., Rigamonti E., Dievart R., Brozek J., Haulon S., Zawadzki C., Jude B., Torpier G., Marx N., Staels B., Chinetti-Gbaguidi G. PPARgamma activation primes human monocytes into alternative M2 macrophages with anti-inflammatory properties. Cell Metab. 2007;6:137–143. - PubMed
    1. Buckingham R.E. Thiazolidinediones: pleiotropic drugs with potent anti-inflammatory properties for tissue protection. Hepatol. Res. 2005;33:167–170. - PubMed

MeSH terms