. 2016 Jul 28;166(3):679-690.
doi: 10.1016/j.cell.2016.05.070. Epub 2016 Jun 30.

Adjacent Codons Act in Concert to Modulate Translation Efficiency in Yeast

Affiliations

Adjacent Codons Act in Concert to Modulate Translation Efficiency in Yeast

Caitlin E Gamble et al. Cell. .

Abstract

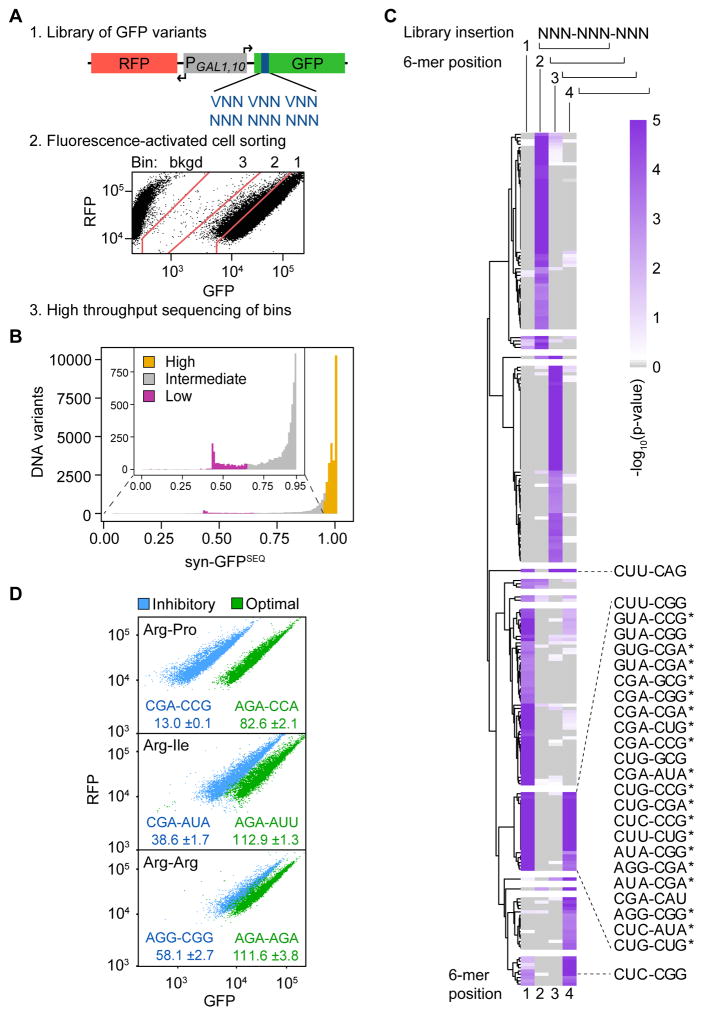
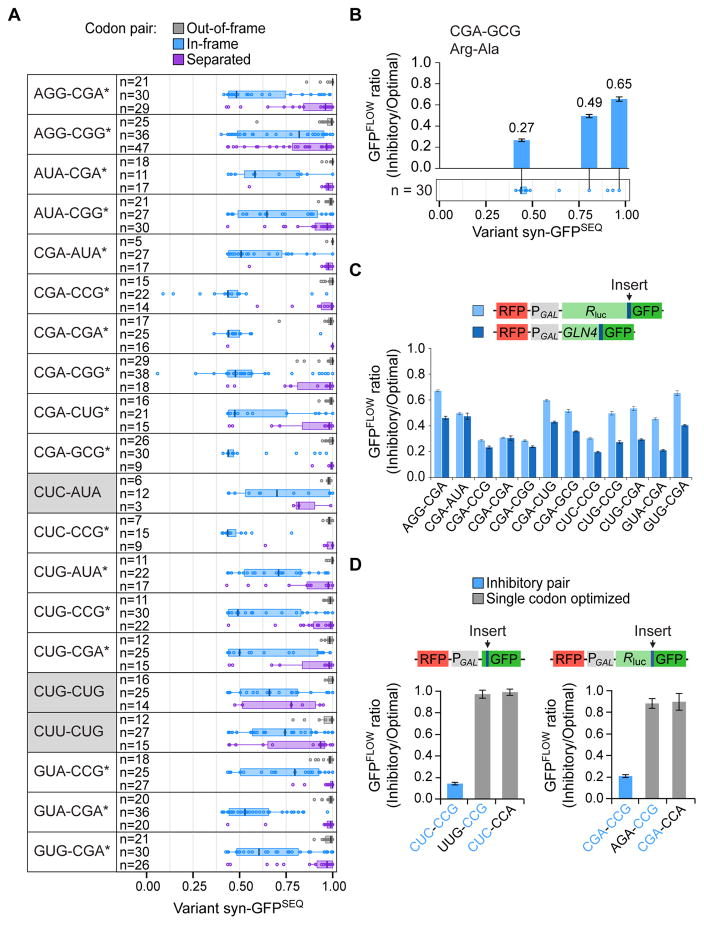
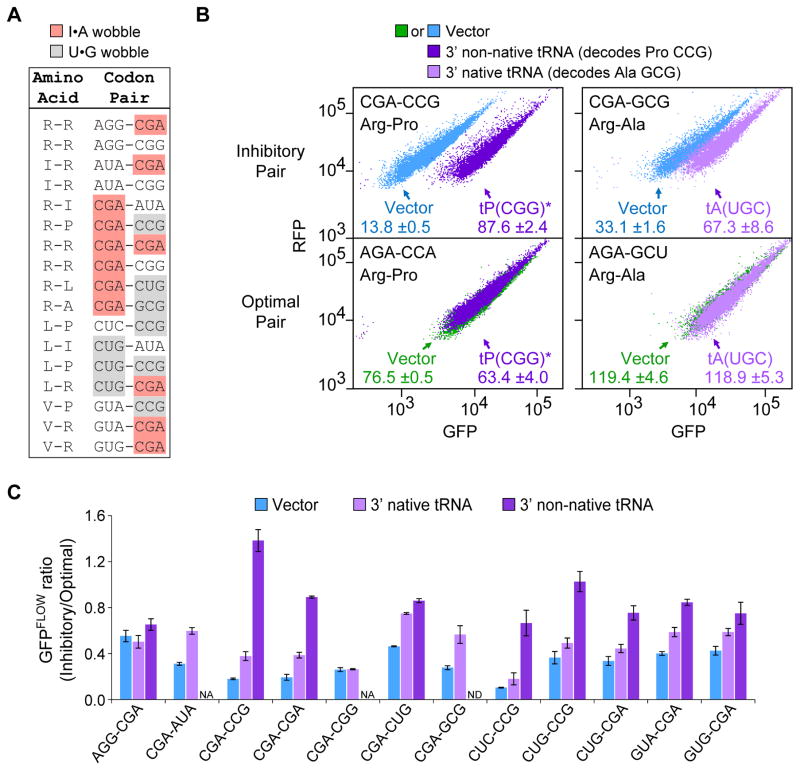
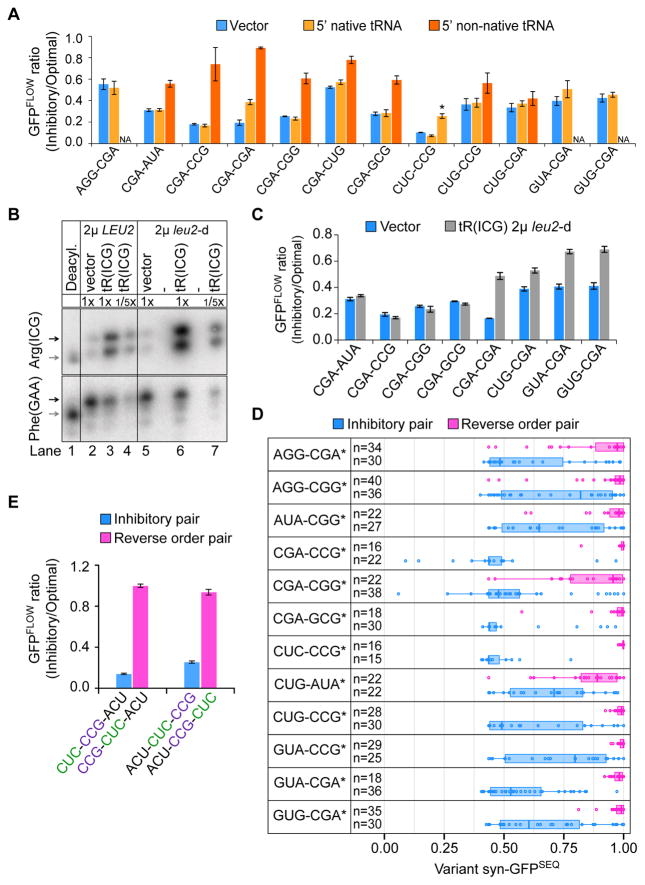
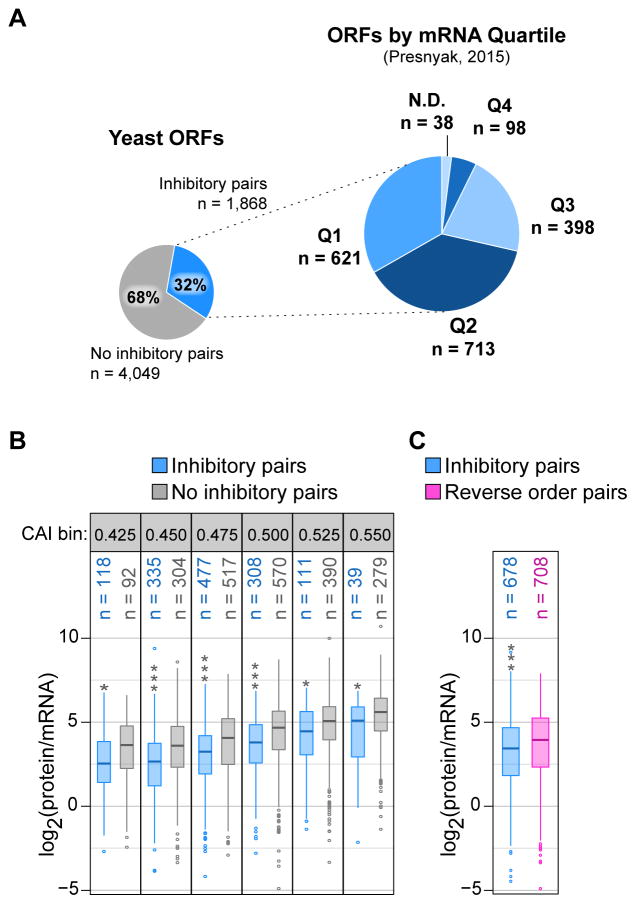
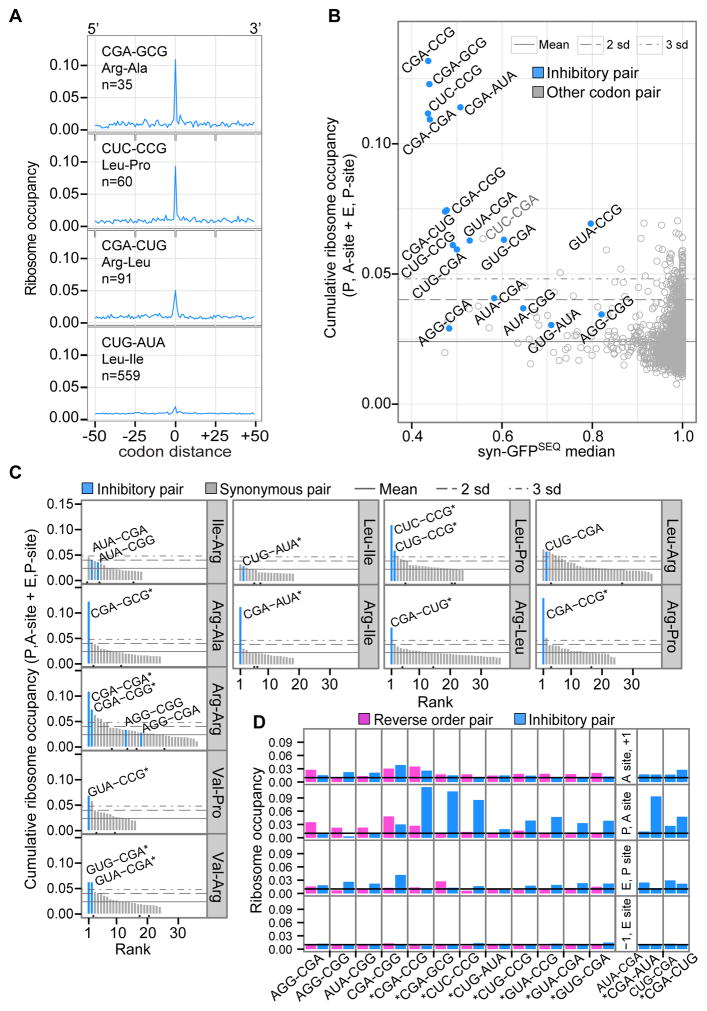
Translation elongation efficiency is largely thought of as the sum of decoding efficiencies for individual codons. Here, we find that adjacent codon pairs modulate translation efficiency. Deploying an approach in Saccharomyces cerevisiae that scored the expression of over 35,000 GFP variants in which three adjacent codons were randomized, we have identified 17 pairs of adjacent codons associated with reduced expression. For many pairs, codon order is obligatory for inhibition, implying a more complex interaction than a simple additive effect. Inhibition mediated by adjacent codons occurs during translation itself as GFP expression is restored by increased tRNA levels or by non-native tRNAs with exact-matching anticodons. Inhibition operates in endogenous genes, based on analysis of ribosome profiling data. Our findings suggest translation efficiency is modulated by an interplay between tRNAs at adjacent sites in the ribosome and that this concerted effect needs to be considered in predicting the functional consequences of codon choice.

Keywords: codon; ribosome; translation; yeast.


Conflict of interest statement

The authors declare no competing financial interests.

Figures

Figure 1
Figure 1. Identification of 6 Base Sequences Linked to Low GFP Expression
(A) Schematic of the method to examine effects of three randomized codons on superfolder GFP expression, using the RNA-ID reporter. Shown is the FACS sort of (NNN)3 Library 1. (B) Distribution of syn-GFPSEQ scores. Variants were assigned to low (magenta; n = 1119), intermediate (gray; n = 5127), and high (gold; n = 24417, excluding high expression synonymous references) expression categories. (C) Significance of 6-mer enrichment in low expression variants by 6-mer position (1–4) in the 9-base variable region (library insertion). 6-mers with at least one p-value ≤ 0.001 are plotted based on hierarchical clustering of positional permutation p-values. Fifty-seven 6-mers are not plotted due to missing values; this includes 6-mers that form an in-frame stop codon. 6-mers with a p-value ≤ 0.001 at both in-frame start positions (1 and 4) are labeled (although CUG-AGG, CUG-AUA*, and CUU-AGG are not plotted because they form a stop codon at another position). Candidate inhibitory pairs that remain enriched in a reduced structure dataset are indicated with a star. (D) Flow cytometry scatter plots from 6 individual variants; label (GFP*100/RFP). See also Tables S1–S4.
FIGURE 2
FIGURE 2. Adjacent Codons Mediate Frame-Dependent Inhibition
(A) syn-GFPSEQ distribution of variants with each of the 20 inhibitory codon pair candidates. Variants with the indicated codon pair in-frame (blue) are compared to variants with the codon pair out-of-frame (the 6-mer at positions 2 and 3) (gray) and variants with the same two codons in-frame, but separated (purple). Boxplot shows median centerline and edges marking the first and third quartiles. Inhibitory pairs that depend upon both frame and adjacent positioning (corrected Wilcoxon p-values ≤ 0.006) are indicated with a star. Pairs with Wilcoxon p-values > 0.006 are shaded in gray. (B) The CGA-GCG pair is inhibitory in different contexts. The GFPFLOW ratio from each of three sets of variants is positioned above the corresponding variant in a syn-GFPSEQ boxplot of all variants with the CGA-GCG codon pair (identical to the blue CGA-GCG boxplot in 2A). The GFPFLOW ratio (Inhibitory/Optimal) is a comparison of GFPFLOW values from two synonymous variants, one with an inhibitory codon pair and the other with an optimized pair. (C) Inhibitory pairs are effective in Renilla luciferase-GFP (light blue) or GLN4(1–99)-GFP (dark blue). Here, the GFPFLOW ratio compares variants with three copies of an inhibitory pair to synonymous variants with three copies of the optimized pair. (D) Each codon in the CUC-CCG and CGA-CCG pairs contributes to inhibition. Shown are schematics of the respective reporters (Renilla luciferase-GFP reporters contain 3 copies of the pair) and the GFPFLOW ratio from each of three sets of variants (inhibitory codon pair, optimized 5′ codon, optimized 3′ codon).
Figure 3
Figure 3. Codon Pair-Mediated Inhibition Affects Translation and is Suppressed by Particular tRNAs
(A) Wobble decoding is prevalent in the 17 inhibitory codon pairs. (B) Flow cytometry scatter plots show GFPFLOW from two sets of variants that contain an inhibitory pair (top panels) or a synonymous optimized pair (bottom panels), in cells with either an empty vector or a plasmid expressing the indicated tRNA; the non-native exact matching tRNA is also indicated by a star. (C) The effect on the GFPFLOW ratio of expressing a tRNA that decodes the 3′ codon in an inhibitory pair. Vector (blue), native tRNA (light purple), non-native tRNA (dark purple). Error bars represent SD. NA, not applicable; ND, not determined.
Figure 4
Figure 4. Inhibition Depends on Codon Order and Pair Effect
(A) The effect on the GFPFLOW ratio of expressing a tRNA that decodes the 5′ codon of an inhibitory pair. Vector (blue), native tRNA (light orange), non-native tRNA (dark orange). Leu CUC is decoded by two native tRNAs; the exact matching tRNA is indicated by a star. Error bars represent SD. NA, not applicable. CGA-CGA data also shown in Figure 3C. (B) Charged tRNAArg(ICG) levels increase when tRNAArg(ICG) is expressed from either a 2μ or 2μ leu2-d vector, as measured with an acidic Northern blot probed for tRNAArg(ICG) and tRNAPhe(GAA). Charged tRNA (black arrow) and uncharged tRNA (gray arrow) are indicated. (C) Effects of increasing native tRNAArg(ICG) by expression from a 2μ leu2-d vector on the GFPFLOW ratio from each of 8 sets of variants (leu2-d vector, blue; tRNAArg(ICG), gray). Error bars represent SD. (D) syn-GFPSEQ distribution of variants with an inhibitory pair (blue) compared to that of variants with the same pair of codons in reverse order (pink). Distributions are plotted for the 12 pairs for which only a single order of the codons is present in the list of inhibitory pairs. Boxplot edges mark the first and third quartiles. Stars indicate a corrected Wilcoxon p-value ≤ 0.006. Blue boxplots are identical to those in Figure 2A. (E) Inhibition by the CUC-CCG pair depends upon the order of the codons. Shown is the GFPFLOW ratio for 2 sets of variants each with an inhibitory pair (blue) and the reverse pair (pink). Error bars represent SD.
Figure 5
Figure 5. Inhibitory Pairs Occur in Genes with Both Low Expression and Translation Efficiency
(A) Proportion of S. cerevisiae ORFs with at least one of the 17 inhibitory pairs (left) and the proportion of these ORFs present in each mRNA abundance quartile (right), as based on steady state, total mRNA (Presnyak et al., 2015). Q1 indicates the bottom 25% of S. cerevisiae transcript abundance. (B) Estimated translation efficiency distribution [protein abundance (Kulak et al., 2014) normalized to mRNA (Presnyak et al., 2015)] for ORFs with at least one inhibitory pair (blue) or no inhibitory pair (gray) and grouped by CAI. CAI bins, labeled by their lower CAI limit, are 0.025 in size. Stars indicate a corrected t-test p-value ≤ 0.01 (*) or ≤ 3.69 × 10⁻⁹ (***). (C) Estimated translation efficiency distribution for ORFs with at least one of twelve inhibitory pairs for which the reverse order pair was not in the inhibitory list (blue) and ORFs with at least one of the reverse order pairs (pink). ORFs with both inhibitory and reverse order pairs were excluded from the analysis. Stars indicate a corrected t-test p-value ≤ 6.34 × 10⁻⁵.
Figure 6
Figure 6. Inhibitory Codon Pairs in Yeast Gene Transcripts Have Elevated Ribosome Occupancies
(A) Examples of ribosome occupancy for an inhibitory pair and surrounding baseline positions. At codon distance 0, the inhibitory pair is positioned in the P and A-sites of the ribosome. Occupancy at each position is the sum of footprints across aligned ORFs and normalized to total footprints from all window positions. (B) Median syn-GFPSEQ of variants with a given pair versus cumulative ribosome occupancy for two positions (with the pair in the P, A-sites and E, P-sites). Horizontal lines represent the mean occupancy of all codon pairs, and 2 or 3 standard deviations above the mean (as indicated). (C) Ranking of synonymous codon pairs by their cumulative ribosome occupancy (at P, A and E, P positions). Black dots below the bars indicate synonymous pairs used in Fisher’s exact comparisons because they have a CAI-optimal codon and a 5′ or 3′ codon identical to one of the inhibitory pairs. (D) Ribosome occupancy by position in the ribosome for inhibitory pairs (blue) and pairs with the reverse codon order (pink). Panels on the right show two sets of pairs for which both codon orders were identified as an inhibitory codon pair. The black line indicates expected occupancy (0.01), based on an even distribution of footprints. Stars indicate inhibitory pairs with higher cumulative occupancy at the P, A-site and E, P-site positions compared to the reverse pair (one-sided Fisher’s exact corrected p-value ≤ 4.63 × 10⁻³²). See also Table S5.

Similar articles

Cited by

References

    1. Alexandrov A, Chernyakov I, Gu W, Hiley SL, Hughes TR, Grayhack EJ, Phizicky EM. Rapid tRNA decay can result from lack of nonessential modifications. Mol Cell. 2006;21:87–96. - PubMed
    1. Artieri CG, Fraser HB. Accounting for biases in riboprofiling data indicates a major role for proline in stalling translation. Genome Res. 2014;24:2011–2021. - PMC - PubMed
    1. Atkins JF, Bjork GR. A gripping tale of ribosomal frameshifting: extragenic suppressors of frameshift mutations spotlight P-site realignment. Microbiol Mol Biol Rev. 2009;73:178–210. - PMC - PubMed
    1. Beggs JD. Transformation of yeast by a replicating hybrid plasmid. Nature. 1978;275:104–109. - PubMed
    1. Boycheva S, Chkodrov G, Ivanov I. Codon pairs in the genome of Escherichia coli. Bioinformatics. 2003;19:987–998. - PubMed

Publication types

MeSH terms