. 2016 Jul 28;166(3):651-663.
doi: 10.1016/j.cell.2016.06.010. Epub 2016 Jun 30.

Compositional Control of Phase-Separated Cellular Bodies

Affiliations

Compositional Control of Phase-Separated Cellular Bodies

Salman F Banani et al. Cell. .

Abstract

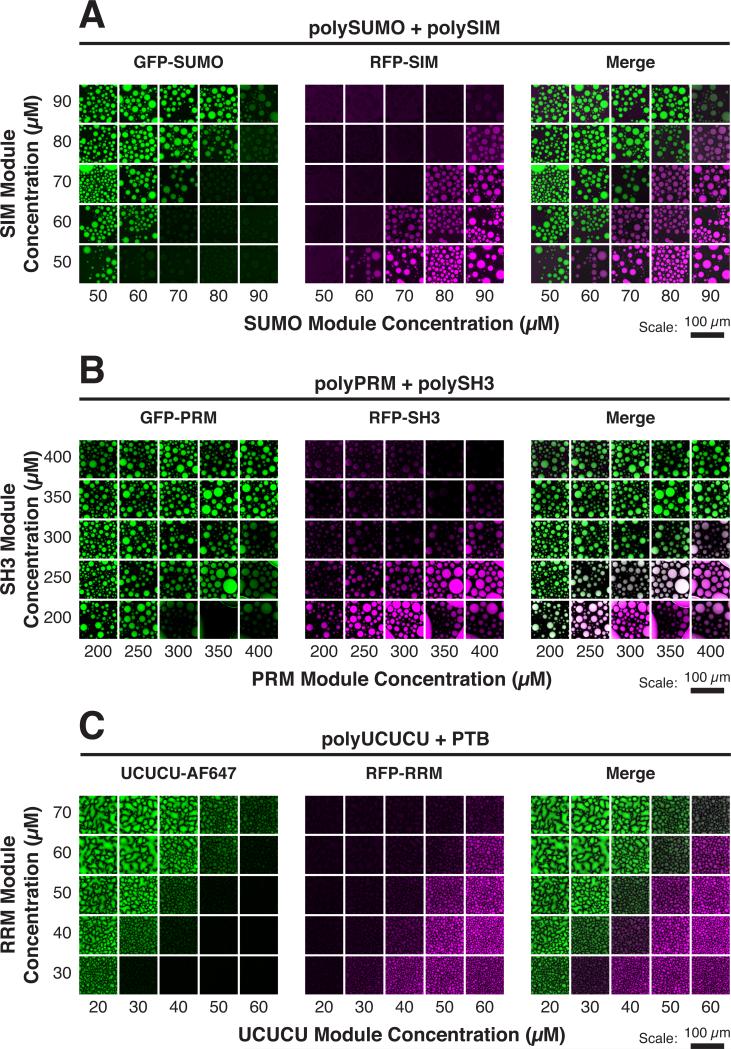
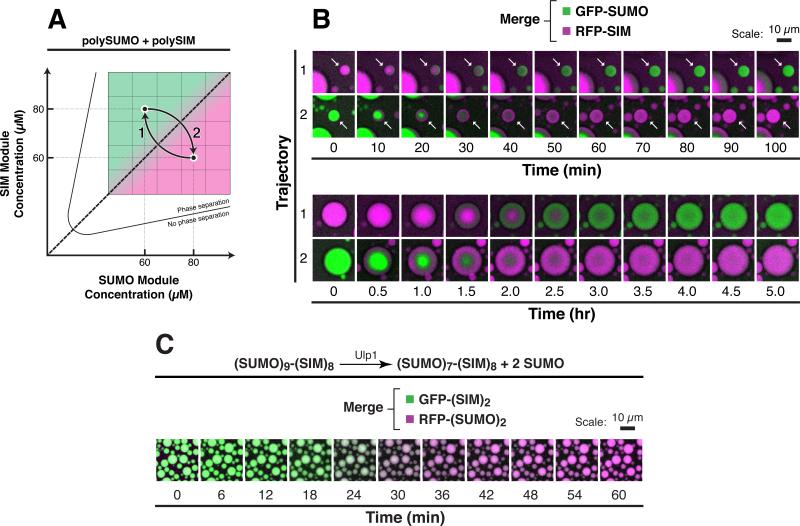
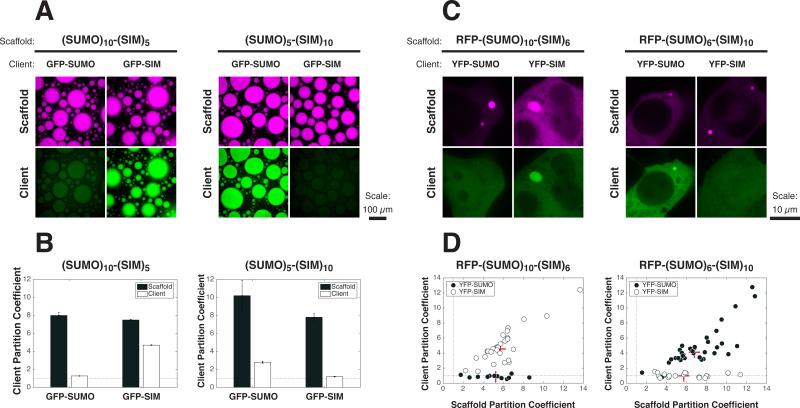
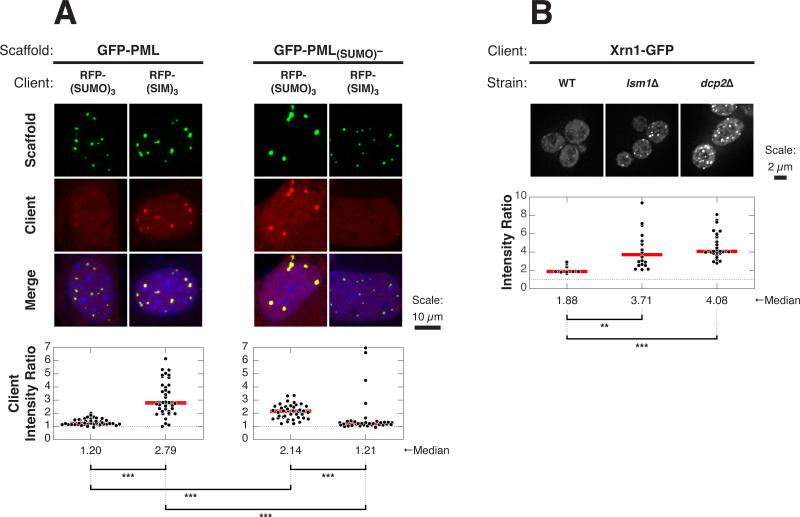
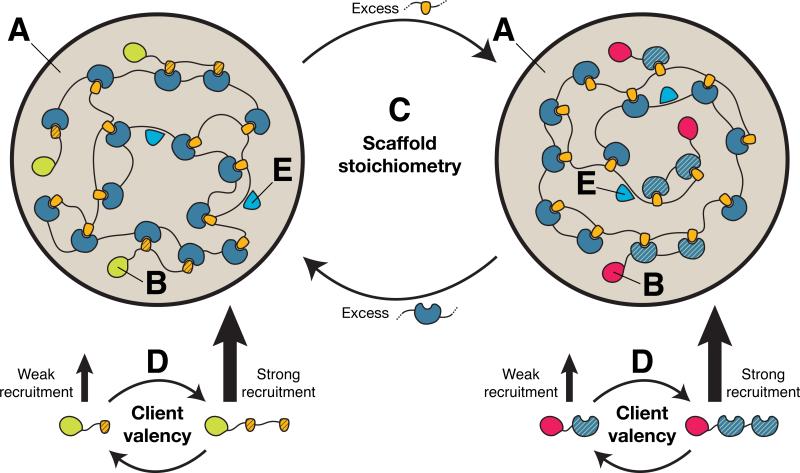
Cellular bodies such as P bodies and PML nuclear bodies (PML NBs) appear to be phase-separated liquids organized by multivalent interactions among proteins and RNA molecules. Although many components of various cellular bodies are known, general principles that define body composition are lacking. We modeled cellular bodies using several engineered multivalent proteins and RNA. In vitro and in cells, these scaffold molecules form phase-separated liquids that concentrate low valency client proteins. Clients partition differently depending on the ratio of scaffolds, with a sharp switch across the phase diagram diagonal. Composition can switch rapidly through changes in scaffold concentration or valency. Natural PML NBs and P bodies show analogous partitioning behavior, suggesting how their compositions could be controlled by levels of PML SUMOylation or cellular mRNA concentration, respectively. The data suggest a conceptual framework for considering the composition and control thereof of cellular bodies assembled through heterotypic multivalent interactions.


Figures

Figure 1
Figure 1. Phase Diagram Position Dictates Client Recruitment
Solutions of multivalent scaffolds plus the indicated clients were imaged for client fluorescence. AF, Alexa fluorophore. (A) GFP-SUMO (green) and RFP-SIM (magenta) (100 nM each) were mixed with the indicated module concentrations of polySUMO and polySIM. (B) GFP-PRM (green) and RFP-SH3 (magenta) (200 nM each) were mixed with the indicated module concentrations of polyPRM and polySH3. (C) UCUCU-AF647 (green) and RFP-RRM (magenta) (200 nM each) were mixed with the indicated module concentrations of polyUCUCU and PTB. See also Figure S1.
Figure 2
Figure 2. Client Valency Affects Partitioning
PCs (means of duplicate samples) of the indicated clients (100 nM) into droplets formed by the indicated module concentrations of polySUMO and polySIM. See also Figure S2 and Table S1.
Figure 3
Figure 3. A Mass Action Model Predicts Client Partitioning Behavior
(A) Imaging of polySUMO and polySIM (1% labeled with AF488 [green] and AF647 [magenta], respectively) fluorescence. (B) PCs (means of duplicate samples) of polySUMO (left) and polySIM (right) calculated from imaging (see Experimental Procedures). (C) Scaffold module concentrations (blue and yellow dots) in the droplet (top) and bulk (bottom) phases at the anti-diagonal data points from panel (B). To model client partitioning, values of concentrations were smoothed and interpolated with a cubic spline to yield continuous curves from discrete data. The continuous, interpolated values were used for subsequent calculations. Error bars represent SEM. Dotted line, phase diagram diagonal. (D) Blue curve shows the ratio of free SUMO sites in the droplet phase to free SUMO sites in the bulk phase. Yellow curve shows the analogous ratio for free SIM sites. (E) Mass action model for the partitioning of a low valency client, L, that binds to free scaffold sites R1 and R2 in the droplet and bulk, respectively (see Experimental Procedures). (F) Predicted PC of clients as a function of affinity for scaffolds. Free site concentrations computed in (E) were used to parameterize the model (C) and predict partitioning of client as a function of their apparent affinity (ranging from 10−2–10−2 μM module) for the scaffolds (see Experimental Procedures). See also Figures S3 and S4 and Table S2.
Figure 4
Figure 4. Droplets Interchange Composition on Cellular Timescales without Compromising Structural Integrity
(A) Schematic of experiment. After equilibration of 100 nM GFP-SUMO and 100 nM RFP-SIM with polySUMO and polySIM at module concentrations of 60 μM and 80 μM, respectively, concentrations of the polySUMO and polySIM were abruptly shifted to 80 μM and 60 μM, respectively, for trajectory 1 and vice versa for trajectory 2. (B) Time lapse imaging of droplets starting immediately after the abrupt change in concentrations of polySUMO and polySIM, showing merged, pseudocolored fluorescence signals from GFP-SUMO (green) and RFP-SIM (magenta). Note that small droplets (white arrows, top) interconvert more quickly than larger droplets (bottom). (C) 6 μM of a (SUMO)9-(SIM)8 scaffold containing Ulp1 cleavage sites after only the two N-terminal SUMOs was equilibrated with 50 nM of GFP-(SIM)2 (green) and RFP-(SUMO)2 (magenta). Time lapse imaging was started immediately after addition of 10 nM of Ulp1. Pseudocolored images showing merged fluorescent signals from the two clients are shown. See also Figure S5 and Table S3.
Figure 5
Figure 5. Cellular PolySUMO-PolySIM Puncta Selectively Recruit Low Valency Clients
(A) 60 nM of GFP-SUMO or GFP-SIM (green) was mixed with 12 μM of (SUMO)10-(SIM)5 (left) or (SUMO)5-(SIM)10 (right) (1% RFP-tagged; magenta), and the resulting droplets were imaged for scaffold and client fluorescence. (B) PCs for both scaffold (black bars) and clients (white bars) from experiment in (A). Graphs show averages from triplicate experiments. Error bars represent SEM. Dotted line, PC = 1. (C) Live cell fluorescence images of YFP-SUMO or YFP-SIM (green) co-transfected with RFP-(SUMO)10-(SIM)6 (left) or RFP-(SUMO)6-(SIM)10 (right) (magenta) into HeLa cells. (D) PCs of scaffolds and client components calculated from cells in the experiment. Each symbol represents the average PC into all puncta (typically 1-3) in a given cell (12-35 cells per sample) when the indicated scaffold was co-transfected with YFP-SUMO (black circles) or YFP-SIM (white circles). Dotted line, PC = 1. Red + sign, median PC. See also Figure S6.
Figure 6
Figure 6. Client Recruitment into Natural Cellular Bodies Is Affected by Scaffold Stoichiometries
(A) Images of RFP-SUMO or RFP-SIM (red) co-transfected with GFP-PML or GFP-PML(SUMO)– (green) into PML−/− MEFs (top); nuclear staining with Hoecsht 33342 (blue). Plots (bottom) show IRs from individual cells (black dots) and median values (red horizontal lines). Each symbol represents the average IR (see Experimental Procedures) for all puncta in a given cell. 32–44 cells were analyzed per sample, each on average containing 16 or 5 puncta per cell with GFP-PML or GFP-PML(SUMO)–, respectively. Distributions were statistically compared using the Wilcoxon rank sum test followed by the Bonferonni correction for multiple comparisons to determine significance. ***p < 0.001. Dotted line, IR = 1. (B) Representative images of WT, lsm1Δ, or dcp2Δ yeast strains carrying Xrn1-GFP (green) in their genomes (top). Distributions of Xrn1-GFP IRs (bottom), where each symbol represents IR corresponding to an individual P body. 1–3 P bodies per cell were analyzed from a set of 4–10 cells per sample. Analysis for significance was performed as in (A). **p < 0.01. See also Figure S7.
Figure 7
Figure 7. A Model for Compositional Control of Cellular Bodies
Multivalent scaffold molecules (high valency blue and yellow molecules) assemble and phase separate to form the body (A). Many client molecules (low valency blue and yellow molecules, with additional domains) are enriched in the body through binding to free cognate sites in the scaffold that is in stoichio-metric excess (B). Client modules have a hatched pattern to distinguish them from scaffold modules. Stoichiometric excess of the scaffold modules can be changed either through changes in the scaffold concentrations (C) or through changes in the scaffold valency (not shown). Since stoichio-metric excess of the scaffolds in droplet (A) and bulk (not shown) changes sharply across the phase diagramdiagonal, the nature ofthe clients alsoswitches sharply across the diagonal. Higher valency promotes stronger recruitment of the clients (D). Molecules that bind to other regions of the scaffolds (E, light blue trianguloids) will be recruited independently of the scaffold stoichiometry. Natural bodies are composed of more complicated molecules, with multiple types of interaction elements, but should follow this same logic.

References

    1. Antolini F, Lo Bello M, Sette M. Purified promyelocytic leukemia coiled-coil aggregates as a tetramer displaying low α-helical content. Protein Expr. Purif. 2003;29:94–102. - PubMed
    1. Ayaydin F, Dasso M. Distinct in vivo dynamics of vertebrate SUMO paralogues. Mol. Biol. Cell. 2004;15:5208–5218. - PMC - PubMed
    1. Banjade S, Wu Q, Mittal A, Peeples WB, Pappu RV, Rosen MK. Conserved interdomain linker promotes phase separation of the multi-valent adaptor protein Nck. Proc. Natl. Acad. Sci. USA. 2015;112:E6426–E6435. - PMC - PubMed
    1. Best JL, Ganiatsas S, Agarwal S, Changou A, Salomoni P, Shirihai O, Meluh PB, Pandolfi PP, Zon LI. SUMO-1 protease-1 regulates gene transcription through PML. Mol. Cell. 2002;10:843–855. - PubMed
    1. Brand P, Lenser T, Hemmerich P. Assembly dynamics of PML nuclear bodies in living cells. PMC Biophys. 2010;3:3. - PMC - PubMed

Publication types