. 2016 Jul 25;26(14):1867-72.
doi: 10.1016/j.cub.2016.05.019. Epub 2016 Jun 30.

Electrical Stimulation of Visual Cortex Can Immediately Improve Spatial Vision

Affiliations

Electrical Stimulation of Visual Cortex Can Immediately Improve Spatial Vision

Robert M G Reinhart et al. Curr Biol. .

Abstract

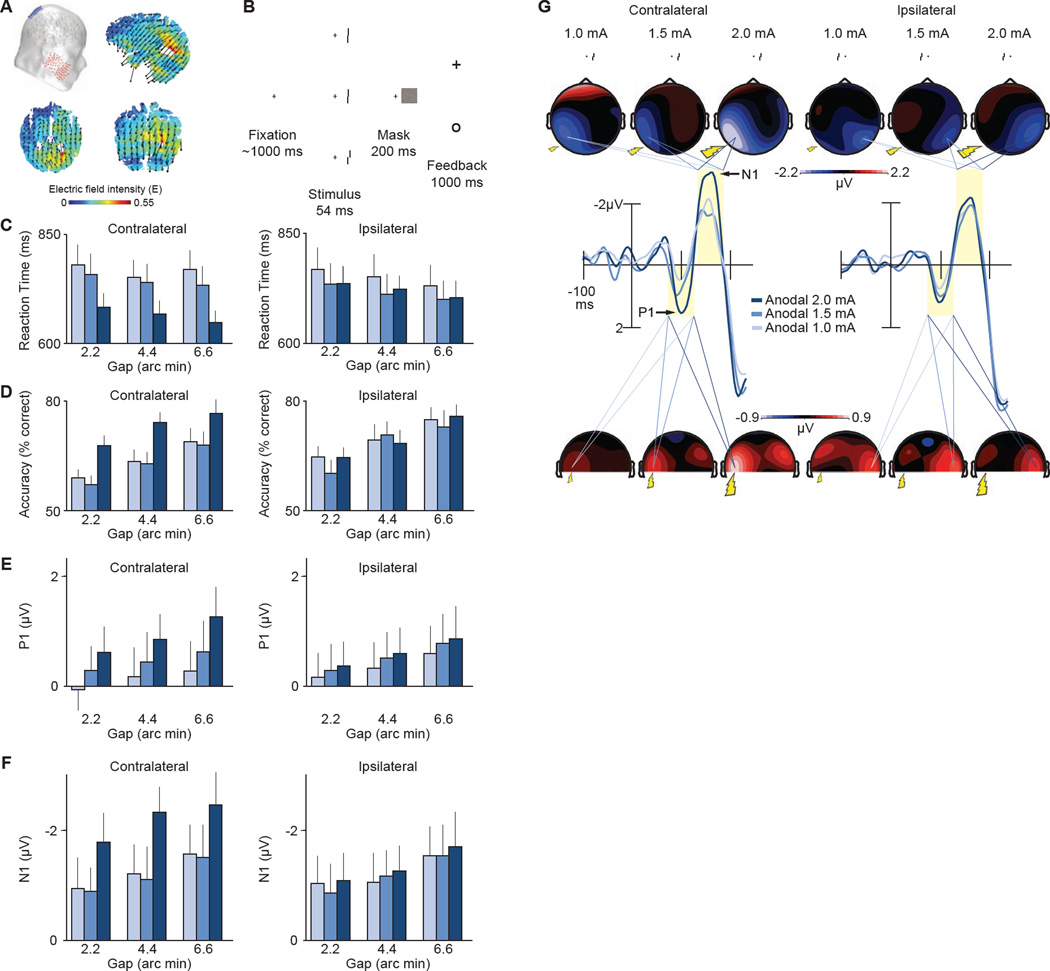
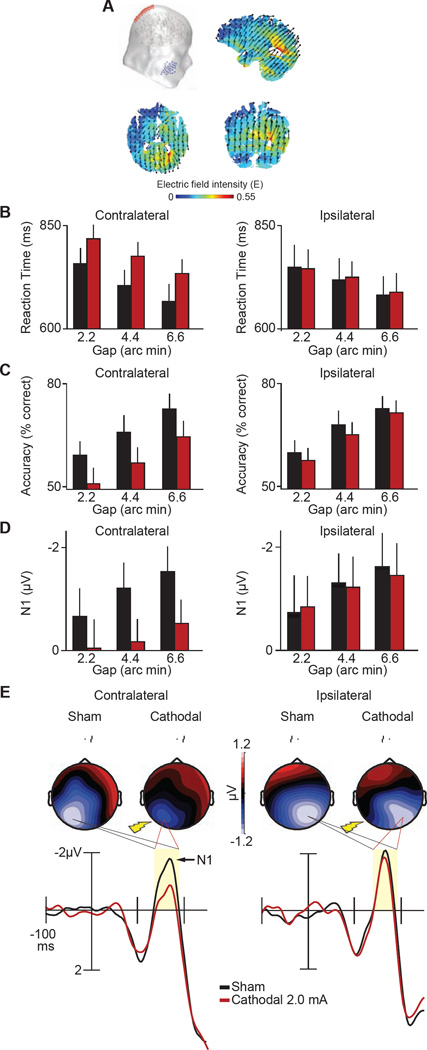
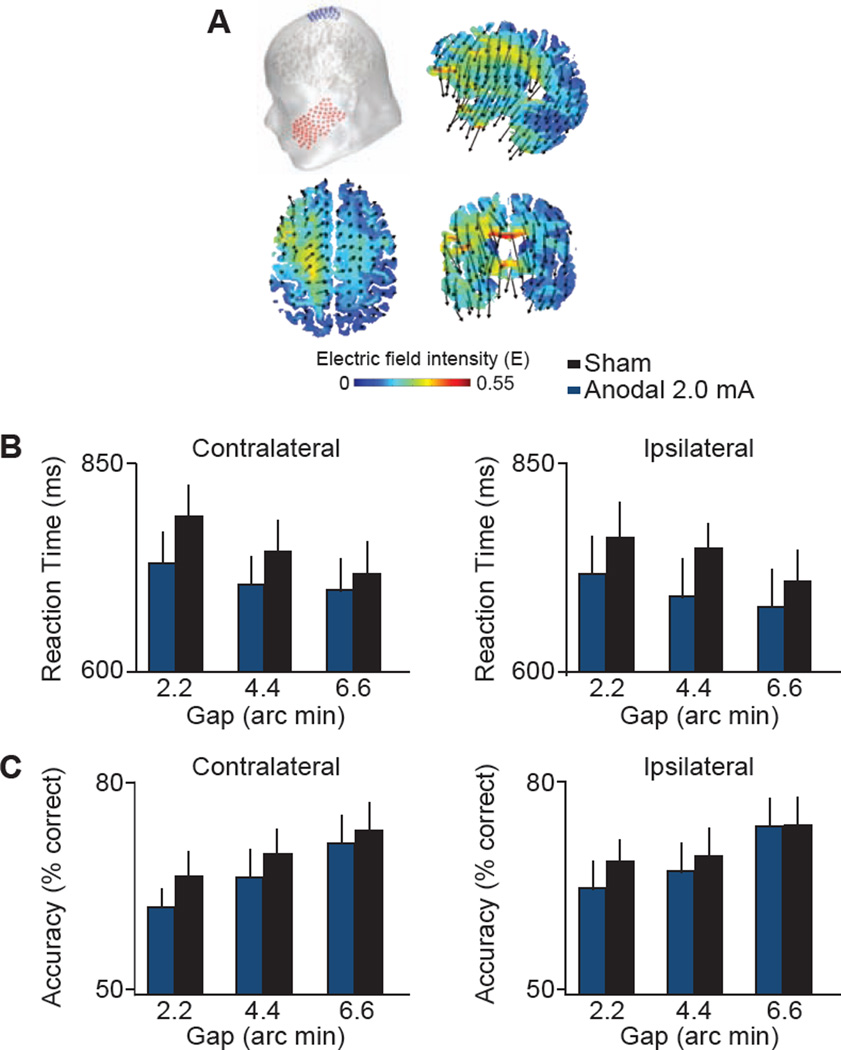
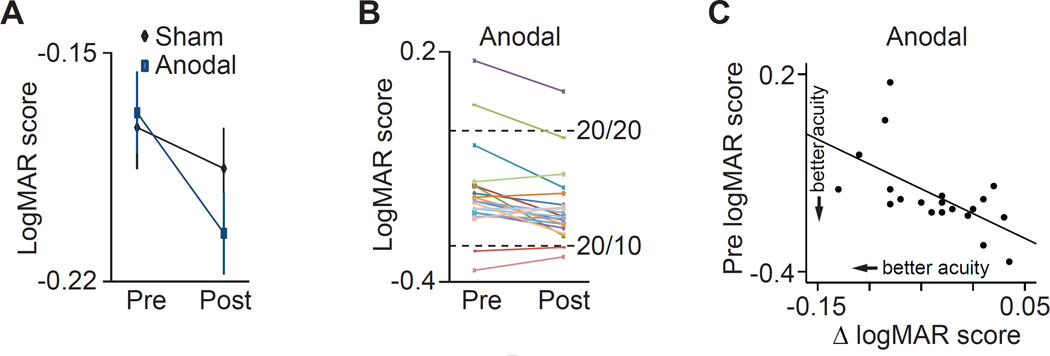
We can improve human vision by correcting the optics of our lenses [1-3]. However, after the eye transduces the light, visual cortex has its own limitations that are challenging to correct [4]. Overcoming these limitations has typically involved innovative training regimes that improve vision across many days [5, 6]. In the present study, we wanted to determine whether it is possible to immediately improve the precision of spatial vision with noninvasive direct-current stimulation. Previous work suggested that visual processing could be modulated with such stimulation [7-9]. However, the short duration and variability of such effects made it seem unlikely that spatial vision could be improved for more than several minutes [7, 10]. Here we show that visual acuity in the parafoveal belt can be immediately improved by delivering noninvasive direct current to visual cortex. Twenty minutes of anodal stimulation improved subjects' vernier acuity by approximately 15% and increased the amplitude of the earliest visually evoked potentials in lockstep with the behavioral effects. When we reversed the orientation of the electric field, we impaired resolution and reduced the amplitude of visually evoked potentials. Next, we found that anodal stimulation improved acuity enough to be measurable with the relatively coarse Snellen test and that subjects with the poorest acuity benefited the most from stimulation. Finally, we found that stimulation-induced acuity improvements were accompanied by changes in contrast sensitivity at high spatial frequencies.

Keywords: direct-current stimulation; electrophysiology; spatial vision; visual acuity.


Conflict of interest statement

Conflict of interest statement: The authors have no competing financial interests.

Figures

Figure 1
Figure 1. Current-flow model, task, and results from Experiment 1
A, Our visual cortex transcranial direct-current stimulation (tDCS) montage with the anode over sites P1 or P2 and cathode over the left or right cheek, respectively. The schematic shows the P2 (anodal) and right cheek (reference) configuration. Saggital, axial, and coronal maps centered on the gravity center of the induced electric field show current flow through the brain. Arrows show orientation of the electric field. Warmer colors show greater electric field magnitude. B, The vernier acuity task requiring subjects to judge the relative position of two line segments in the periphery while maintaining central fixation. Subjects indicated with one of two buttons on a gamepad whether the upper line was offset to the left or right of the lower line. Mean correct reaction time (RT) (C) and accuracy (D) across offset size (2.2, 4.4, 6.6 arc min), and tDCS intensity level (1.0, 1.5, 2.0 mA). Data are binned according to the location of vernier stimuli with respect to tDCS application (contralateral, ipsilateral). For example, contralateral data include trials with left visual field stimuli following right hemisphere tDCS, and trials with right visual field stimuli following left hemisphere tDCS. See also Figure S1 for accuracy across the entire experimental session and see Figure S2 for how this performance is related to improvements in contrast sensitivity. Mean amplitude of the P1 (E) and N1 (F) event-related potentials (ERPs) as in C–D. G, Waveforms time-locked to the onset of the vernier stimuli and related topographical maps across tDCS and laterality conditions. Shaded regions show the analysis windows for the P1 (75–125 ms) and N1 (140–190 ms) component amplitudes. Topographies show data collapsed across vernier stimulus locations and the hemispheres of tDCS application using a method that preserved the electrode location relative to the location of the stimuli. All contralateral signals are projected onto the left hemisphere (contralateral) and ipsilateral signals projected onto the right hemisphere (ipsilateral). See Table S1 for the results of the statistical analyses in their entirety.
Figure 2
Figure 2. Current-flow model and results from Experiment 2
A, Our visual cortex transcranial direct-current stimulation (tDCS) montage used a cathodal electrode over P1 or P2 sites (International 10–20 System) paired with an anodal electrode over the left or right cheek, respectively. The schematic here shows the P2 (cathodal) and right cheek (reference) configuration. Saggital, axial, and coronal maps centered on the gravity center of the induced electric field show current flow through the brain. Arrows denote the orientation of the electric field, and warmer colors denote greater electric field magnitude. Mean correct reaction time (RT) (B) and accuracy (C) for vernier offset discrimination as a function of gap offset size (2.2, 4.4, 6.6 arc min), and tDCS condition (sham, black; 2.0 mA cathodal, red). Data are sorted by the location of the vernier stimuli with respect to tDCS application (contralateral, ipsilateral) as in Figure 1. D, Mean N1 amplitude as in B–C. E, Waveforms time-locked to the onset of the vernier stimuli and related topographies across tDCS and laterality conditions. Arrow shows N1 component. Shaded regions show the analysis window for the N1 component amplitude (140–190 ms). Topographies show all contralateral and ipsilateral signals as described in Figure 1G. See Table S1 for the results of the statistical analyses in their entirety.
Figure 3
Figure 3. Current-flow model and results from Experiment 3
A, Our motor cortex transcranial direct-current stimulation (tDCS) montage used an anodal electrode over C1 or C2 sites (International 10-20 System) paired with a cathodal electrode over the left or right cheek, respectively. The schematic shows the C1 (anodal) and left cheek (cathodal) configuration. Saggital, axial, and coronal maps centered on the gravity center of the induced electric field show current flow through the brain. Arrows denote the orientation of the electric field, and warmer colors denote greater electric field magnitude. Mean correct reaction time (RT) (B) and accuracy (C) for the vernier stimuli as a function of gap offset size (2.2, 4.4, 6.6 arc min), and tDCS condition (sham, 2.0 mA anodal). Data are sorted by laterality (contralateral, ipsilateral) as in Figures 1–2.
Figure 4
Figure 4. Results from Experiment 4
A, Mean logMAR scores from the Snellen eye chart before (pre) and after (post) the sham and anodal visual cortex tDCS at 2.0 mA intensity. B, Individual subject data shows the change in logMAR score before and after anodal tDCS. C, Scatter plot shows the relationship between a subject’s score on the Snellen test before anodal stimulation (pre logMAR score) and their improvement following anodal stimulation (i.e., post minus pre logMAR score). Smaller logMAR scores reflect better performance (i.e., more letters read correctly). See Table S1 for the results of the statistical analyses in their entirety.

References

    1. Hamill MB, Koch DD. Refractive surgery - the cutting edge. Nature Medicine. 1996;2:640–741. - PubMed
    1. Palmer SE. Vision science: Photons to phenomenology. Cambridge, MA: Bradford Books/MIT Press; 1999.
    1. Dolgin E. The myopia boom. Nature. 2015;519:276–278. - PubMed
    1. Dutton GN. Cognitive vision, its disorders and differential diagnosis in adults and children: knowing where and what things are. Eye. 2003;17:289–304. - PubMed
    1. Anderson DE, Vogel EK, Awh E. Precision in visual working memory reaches a stable plateau when individual item limits are exceeded. Journal of Neuroscience. 2011;31:1128–1138. - PMC - PubMed

Publication types

LinkOut - more resources