. 2016 Jul 12;24(1):158-66.
doi: 10.1016/j.cmet.2016.06.004. Epub 2016 Jun 30.

Itaconate Links Inhibition of Succinate Dehydrogenase with Macrophage Metabolic Remodeling and Regulation of Inflammation

Affiliations

Itaconate Links Inhibition of Succinate Dehydrogenase with Macrophage Metabolic Remodeling and Regulation of Inflammation

Vicky Lampropoulou et al. Cell Metab. .

Abstract

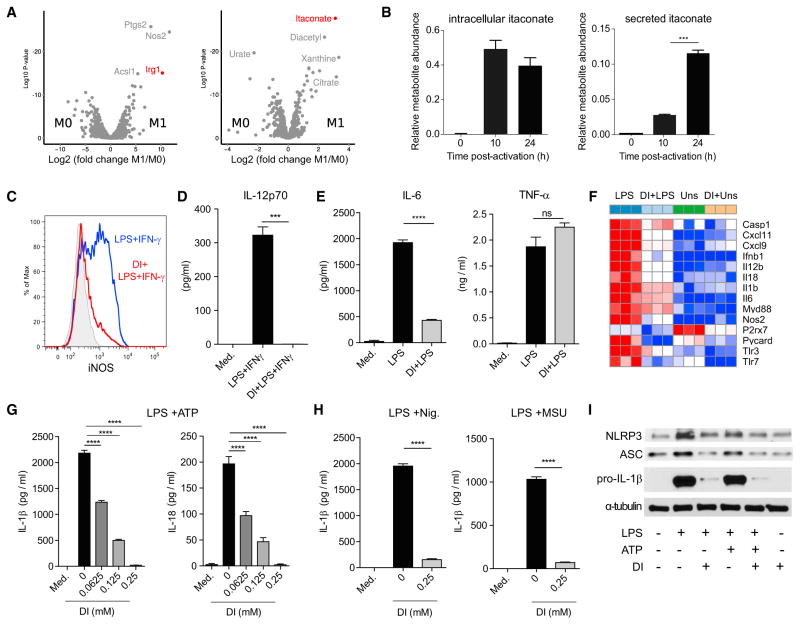
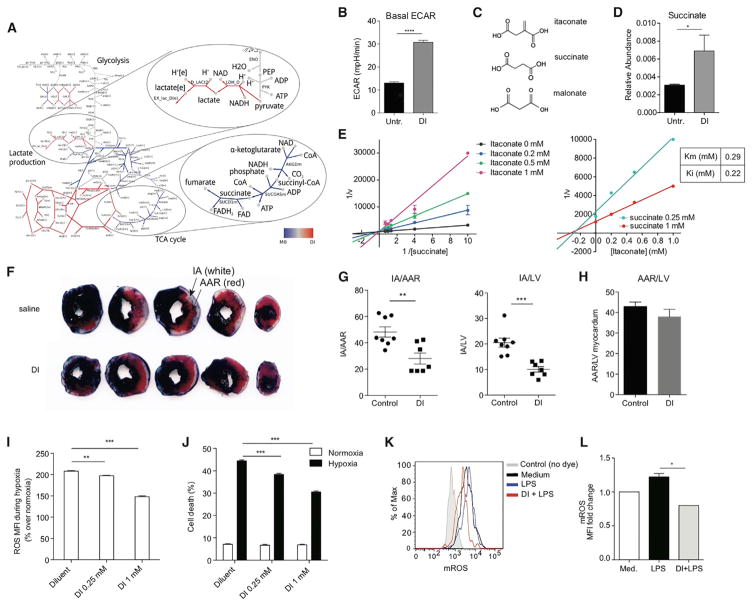
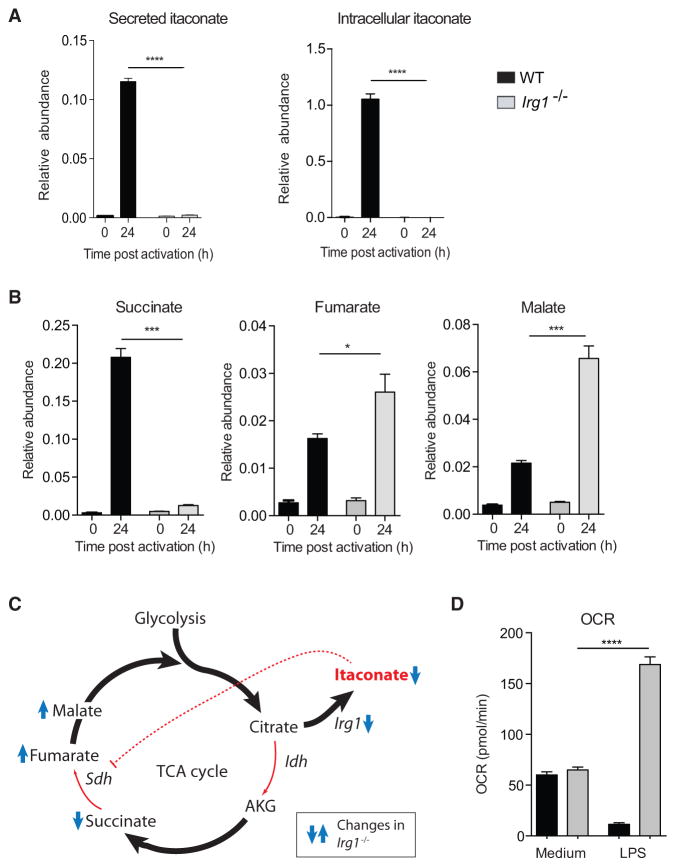
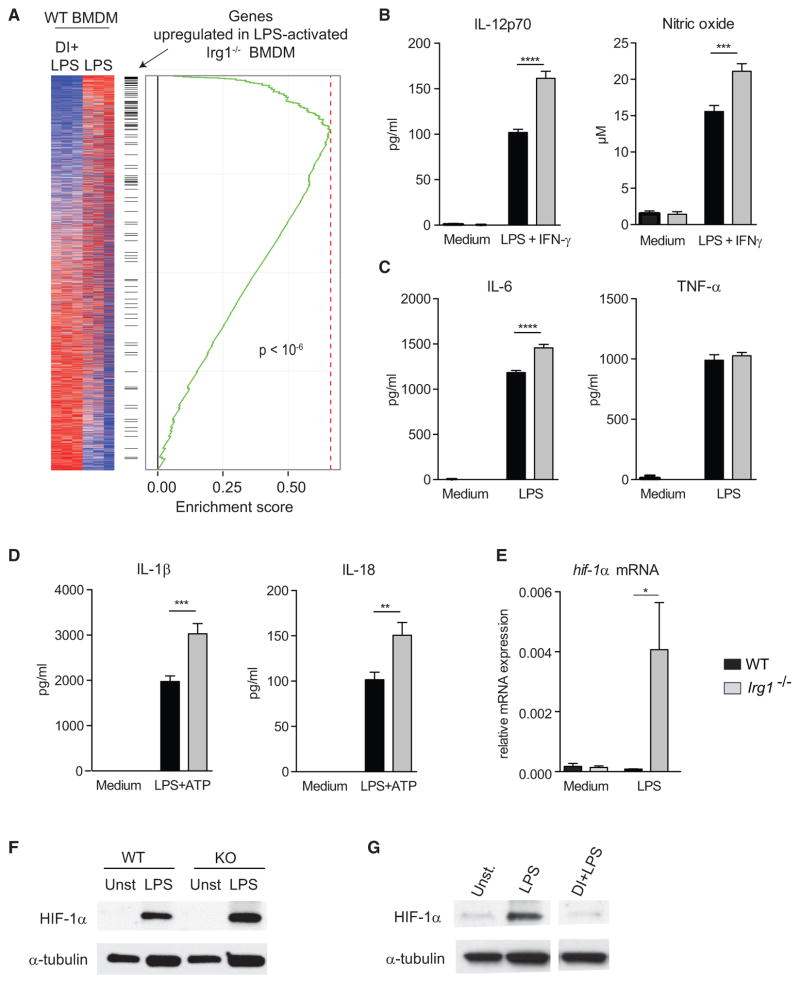
Remodeling of the tricarboxylic acid (TCA) cycle is a metabolic adaptation accompanying inflammatory macrophage activation. During this process, endogenous metabolites can adopt regulatory roles that govern specific aspects of inflammatory response, as recently shown for succinate, which regulates the pro-inflammatory IL-1β-HIF-1α axis. Itaconate is one of the most highly induced metabolites in activated macrophages, yet its functional significance remains unknown. Here, we show that itaconate modulates macrophage metabolism and effector functions by inhibiting succinate dehydrogenase-mediated oxidation of succinate. Through this action, itaconate exerts anti-inflammatory effects when administered in vitro and in vivo during macrophage activation and ischemia-reperfusion injury. Using newly generated Irg1(-/-) mice, which lack the ability to produce itaconate, we show that endogenous itaconate regulates succinate levels and function, mitochondrial respiration, and inflammatory cytokine production during macrophage activation. These studies highlight itaconate as a major physiological regulator of the global metabolic rewiring and effector functions of inflammatory macrophages.


Figures

Figure 1
Figure 1. Itaconate Has Anti-inflammatory Effects on Macrophage Activation
(A) Volcano plots showing transcripts (left) and metabolites (right) that are differentially expressed between resting and activated BMDM (LPS + IFN-γ, 24 hr). (B) Relative expression of intracellular and secreted itaconate by BMDM at indicated time points after activation (LPS + IFN-γ). (C) Histogram of intracellular iNOS expression determined by flow cytometry in BMDM untreated or DI-pretreated (0.25 mM, 12 hr) and then stimulated with LPS + IFN-γ (24 hr). (D) IL-12 levels in BMDM culture supernatants from (C). (E) IL-6 and TNF-α secreted by untreated or DI-pretreated BMDM and stimulated with LPS (24 hr). (F) Heatmap of selected inflammatory marker genes unstimulated (Uns), LPS-stimulated (LPS), DI-pretreated (DI + Uns), DI-pretreated and then LPS-stimulated BMDM (4 hr). (G) Mature IL-1β and IL-18 secreted by BMDM untreated or DI-pretreated, then stimulated with LPS (4 hr) and ATP (45 min). (H) Mature IL-1β levels secreted by BMDM untreated or DI-pretreated and stimulated with LPS and nigericin (Nig.) or monosodium urate crystals (MSU). (I) Western blot analysis of NLRP3, pro-IL-1β, and ASC in lysates of BMDM untreated or DI-pretreated and stimulated as in (G). α-tubulin was used as loading control. Blot shown is representative of two independent experiments. For (B), (E), (G), and (H), data are shown as mean ± SEM (n = 3). p values were calculated using two-tailed Student’s t test (B and E) or one-way ANOVA compared to untreated stimulated cells (G and H). *p < 0.05; **p < 0.01; ***p < 0.001; ****p < 0.0001. See also Figure S1.
Figure 2
Figure 2. Itaconate Inhibits Sdh Activity In Vitro and In Vivo and Modulates ROS-Mediated Tissue Damage during Ischemia-Reperfusion Injury
(A) Comparative network showing changes in the magnitude of predicted fluxes between unstimulated macrophages with and without itaconate treatment. (B) Extracellular acidification rate (ECAR) measured in DI-treated or untreated BMDM. Data are shown as mean ± SEM of 10–15 replicates from one of two representative experiments. (C) Chemical structure of succinate, malonate, and itaconate. (D) Relative succinate levels in resting BMDM treated or not with DI. Data are shown as mean ± SEM (n = 3). p values were calculated using two-tailed Student’s t test. (E) Lineweaver-Burk plot (left), Dixon plot (right), and calculated Km and Ki values. Data shown are mean ± SD (L-B plot, n = 3) and mean (Dixon plot, n = 3). (F) Representative Evans Blue and TTC stained sections of hearts subjected to IR injury, after DI or saline treatment. (G and H) Quantitation of area-at-risk (AAR) and infarct area (IA) as percent of AAR (G) and left ventricular (LV) myocardium (H) (saline, n = 8; DI, n = 7). p values were calculated using two-tailed Student’s t test. (I) Percentage change in ROS (over respective normoxic controls) in neonatal rat cardiac myocytes (NRCMs) subjected to hypoxia for 24 hr in the presence of DI or diluent. (J) Percentage of cell death in NRCMs treated as in (H). For (I) and (J), p values were calculated using post hoc test after one-way ANOVA (n = 8/condition). (K) Histograms of mROS expression detected using MitoSox dye in BMDM pretreated or not with DI and activated with LPS (3 hr). (L) Fold change in mROS mean fluorescence intensity (relative to medium) measured in (K). Data are shown as mean ± SEM (n = 3, each in duplicates). p value was calculated using two-tailed Student’s t test. *p < 0.05; **p < 0.01; ***p < 0.001. See also Figure S2.
Figure 3
Figure 3. Endogenous Itaconate Controls TCA Cycle Remodeling and Succinate Levels
(A) Relative expression of secreted and intracellular itaconate by WT and Irg1−/− BMDM after activation with LPS + IFN-γ. (B) Relative expression of succinate, fumarate, and malate in cell extracts from (A). (C) Scheme showing how itaconate regulates TCA flow in LPS-activated macrophages. (D) Basal oxygen consumption rate by resting (medium) and LPS-activated BMDM (24 hr) from WT and Irg1−/− mice. Data are shown as mean ± SEM (A and B, n = 3; D, n = 2 total technical replicates 13–55). p values were calculated using two-tailed Student’s t test. *p < 0.05; ***p < 0.001; ****p < 0.0001. See also Figure S3.
Figure 4
Figure 4. LPS-Activated Irg1−/− Macrophages, which Lack Itaconate, Show Augmented Inflammatory Responses
(A) Transcriptional signatures of activated Irg1−/− and DI-treated activated WT BMDM are inversely related. (B) IL-12 and NO levels in supernatants of WT and Irg1−/− BMDM stimulated with LPS + IFN-γ (24 hr). (C) IL-6 and TNF-α levels in supernatants of LPS-activated (24 hr) WT and Irg1−/− BMDM. (D) Mature IL-1β and IL-18 levels in supernatants of WT and Irg1−/− BMDM stimulated with LPS (4 hr) and ATP. (E) Relative hif1a mRNA expression in LPS-activated WT and Irg1−/− BMDM (4 hr). (F) Western blot analysis of HIF-1α in lysates of WT and Irg1−/− BMDM activated as in (E); α-tubulin was used as a loading control. Blot shown is representative of two independent experiments. (G) Western blot analysis of HIF-1α in lysates of WT BMDM untreated or DI-treated and activated with LPS (24 hr). Blot shown is representative of two independent experiments. Data in (B)–(E) are shown as mean ± SEM (n = 3/group, each in 2–3 replicates). p values were calculated with two-tailed Student’s t test. *p < 0.05; **p < 0.01; ***p < 0.001; ****p < 0.0001.

References

    1. Ackermann WW, Potter VR. Enzyme inhibition in relation to chemotherapy. Proc Soc Exp Biol Med. 1949;72:1–9. - PubMed
    1. Bauernfeind F, Bartok E, Rieger A, Franchi L, Núñez G, Hornung V. Cutting edge: reactive oxygen species inhibitors block priming, but not activation, of the NLRP3 inflammasome. J Immunol. 2011;187:613–617. - PMC - PubMed
    1. Becker SA, Palsson BO. Context-specific metabolic networks are consistent with experiments. PLoS Comput Biol. 2008;4:e1000082. - PMC - PubMed
    1. Bennett BD, Kimball EH, Gao M, Osterhout R, Van Dien SJ, Rabinowitz JD. Absolute metabolite concentrations and implied enzyme active site occupancy in Escherichia coli. Nat Chem Biol. 2009;5:593–599. - PMC - PubMed
    1. Bordbar A, Mo ML, Nakayasu ES, Schrimpe-Rutledge AC, Kim YM, Metz TO, Jones MB, Frank BC, Smith RD, Peterson SN, et al. Model-driven multi-omic data analysis elucidates metabolic immunomodulators of macrophage activation. Mol Syst Biol. 2012;8:558. - PMC - PubMed

Publication types

MeSH terms