

An automated system for evaluation of the potential functionome: MAPLE version 2.1.0
- PMID: 27374611
- PMCID: PMC5066172
- DOI: 10.1093/dnares/dsw030
An automated system for evaluation of the potential functionome: MAPLE version 2.1.0
Abstract
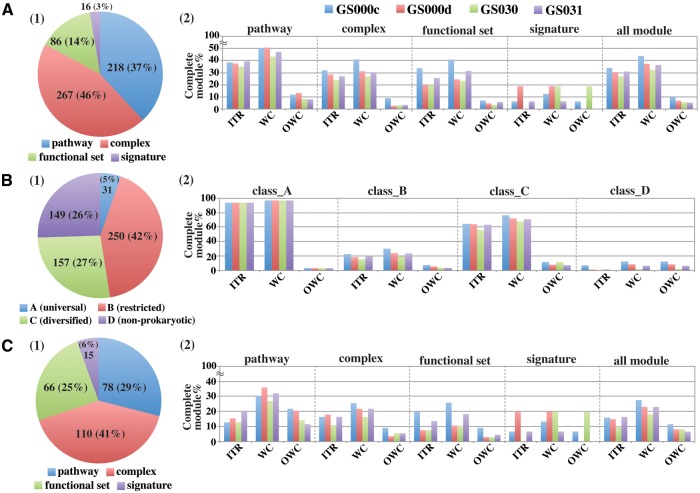
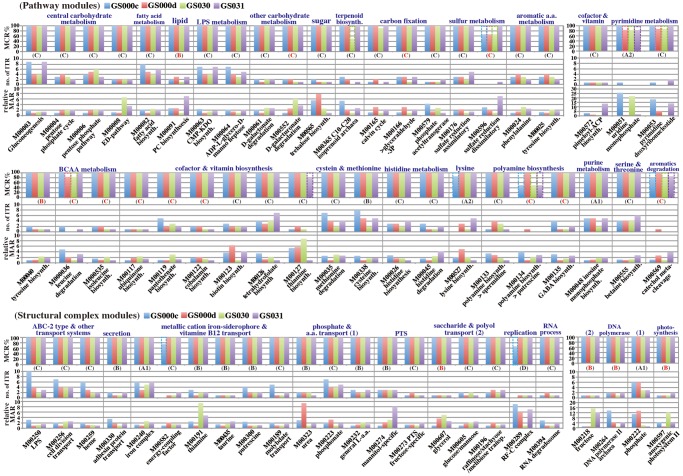
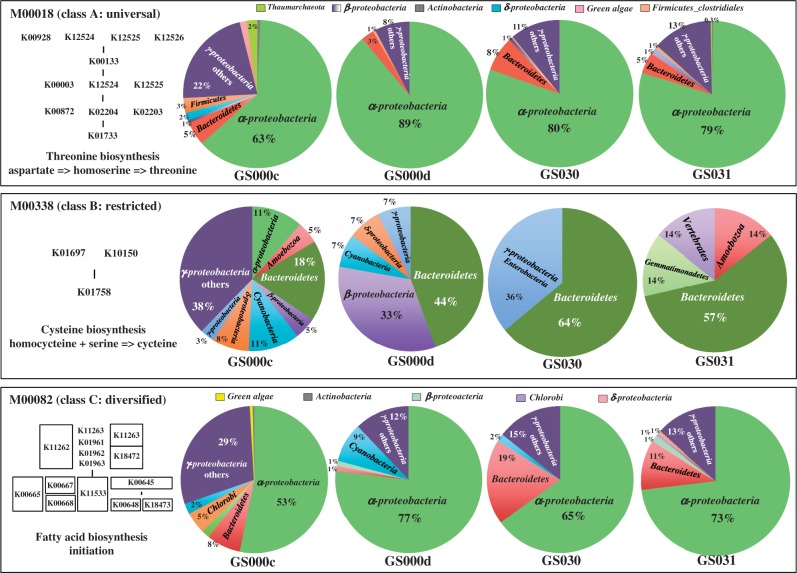
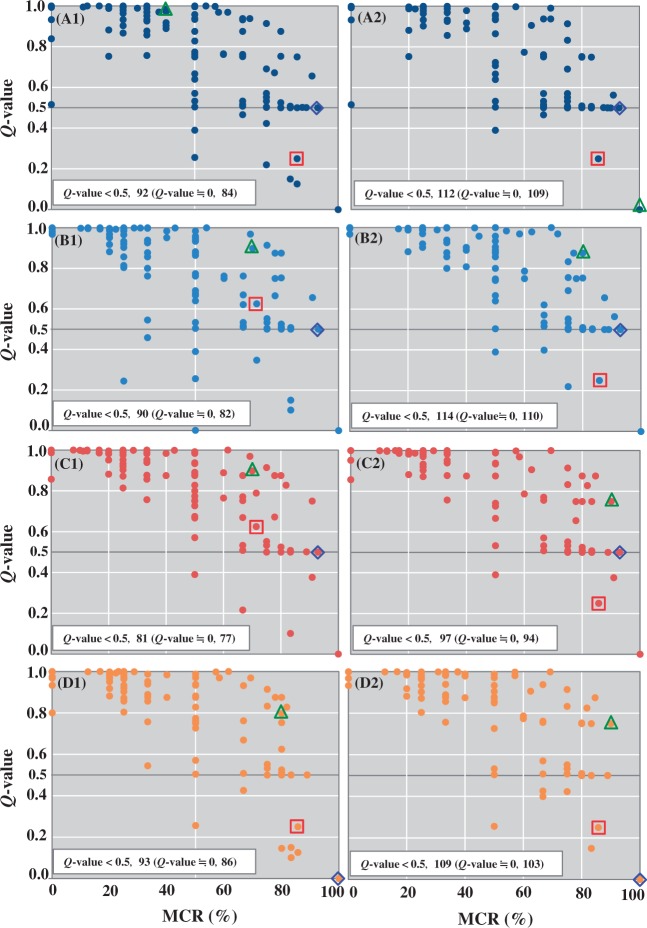
Metabolic and physiological potential evaluator (MAPLE) is an automatic system that can perform a series of steps used in the evaluation of potential comprehensive functions (functionome) harboured in the genome and metagenome. MAPLE first assigns KEGG Orthology (KO) to the query gene, maps the KO-assigned genes to the Kyoto Encyclopedia of Genes and Genomes (KEGG) functional modules, and then calculates the module completion ratio (MCR) of each functional module to characterize the potential functionome in the user's own genomic and metagenomic data. In this study, we added two more useful functions to calculate module abundance and Q-value, which indicate the functional abundance and statistical significance of the MCR results, respectively, to the new version of MAPLE for more detailed comparative genomic and metagenomic analyses. Consequently, MAPLE version 2.1.0 reported significant differences in the potential functionome, functional abundance, and diversity of contributors to each function among four metagenomic datasets generated by the global ocean sampling expedition, one of the most popular environmental samples to use with this system. MAPLE version 2.1.0 is now available through the web interface (http://www.genome.jp/tools/maple/) 17 June 2016, date last accessed.
Keywords: MAPLE; global ocean sampling (GOS); metabolic pathway; metagenome.
© The Author 2016. Published by Oxford University Press on behalf of Kazusa DNA Research Institute.
Figures
Similar articles
-
Evaluation method for the potential functionome harbored in the genome and metagenome.BMC Genomics. 2012 Dec 12;13:699. doi: 10.1186/1471-2164-13-699. BMC Genomics. 2012. PMID: 23234305 Free PMC article.
-
BlastKOALA and GhostKOALA: KEGG Tools for Functional Characterization of Genome and Metagenome Sequences.J Mol Biol. 2016 Feb 22;428(4):726-731. doi: 10.1016/j.jmb.2015.11.006. Epub 2015 Nov 14. J Mol Biol. 2016. PMID: 26585406 Review.
-
MAPLE 2.3.0: an improved system for evaluating the functionomes of genomes and metagenomes.Biosci Biotechnol Biochem. 2018 Sep;82(9):1515-1517. doi: 10.1080/09168451.2018.1476122. Epub 2018 May 24. Biosci Biotechnol Biochem. 2018. PMID: 29792119
-
KEGG Mapper for inferring cellular functions from protein sequences.Protein Sci. 2020 Jan;29(1):28-35. doi: 10.1002/pro.3711. Epub 2019 Aug 29. Protein Sci. 2020. PMID: 31423653 Free PMC article.
-
Vikodak--A Modular Framework for Inferring Functional Potential of Microbial Communities from 16S Metagenomic Datasets.PLoS One. 2016 Feb 5;11(2):e0148347. doi: 10.1371/journal.pone.0148347. eCollection 2016. PLoS One. 2016. PMID: 26848568 Free PMC article.
Cited by
-
Genetic adaptation of microbial populations present in high-intensity catfish production systems with therapeutic oxytetracycline treatment.Sci Rep. 2017 Dec 13;7(1):17491. doi: 10.1038/s41598-017-17640-3. Sci Rep. 2017. PMID: 29235508 Free PMC article.
-
The physiological potential of anammox bacteria as revealed by their core genome structure.DNA Res. 2021 Jan 19;28(1):dsaa028. doi: 10.1093/dnares/dsaa028. DNA Res. 2021. PMID: 33367889 Free PMC article.
-
Gene family innovation, conservation and loss on the animal stem lineage.Elife. 2018 May 31;7:e34226. doi: 10.7554/eLife.34226. Elife. 2018. PMID: 29848444 Free PMC article.
-
Complete Genome Sequence of Altererythrobacter sp. Strain B11, an Aromatic Monomer-Degrading Bacterium, Isolated from Deep-Sea Sediment under the Seabed off Kashima, Japan.Genome Announc. 2018 Mar 22;6(12):e00200-18. doi: 10.1128/genomeA.00200-18. Genome Announc. 2018. PMID: 29567747 Free PMC article.
-
EXPath tool-a system for comprehensively analyzing regulatory pathways and coexpression networks from high-throughput transcriptome data.DNA Res. 2017 Aug 1;24(4):371-375. doi: 10.1093/dnares/dsx009. DNA Res. 2017. PMID: 28338930 Free PMC article.
References
LinkOut - more resources
Full Text Sources
Other Literature Sources
Research Materials
