. 2017 Jan 26;36(4):525-533.
doi: 10.1038/onc.2016.223. Epub 2016 Jul 4.

Androgen deprivation leads to increased carbohydrate metabolism and hexokinase 2-mediated survival in Pten/Tp53-deficient prostate cancer

Affiliations

Androgen deprivation leads to increased carbohydrate metabolism and hexokinase 2-mediated survival in Pten/Tp53-deficient prostate cancer

P L Martin et al. Oncogene. .

Abstract

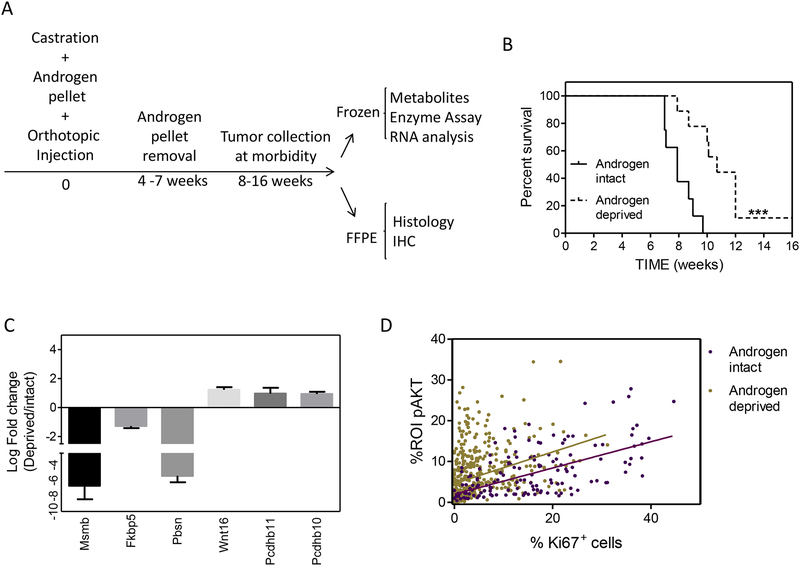
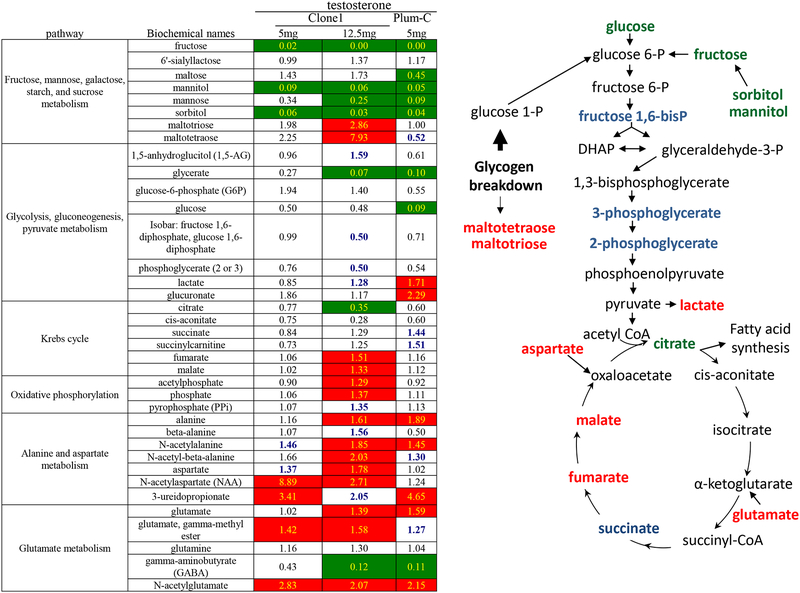
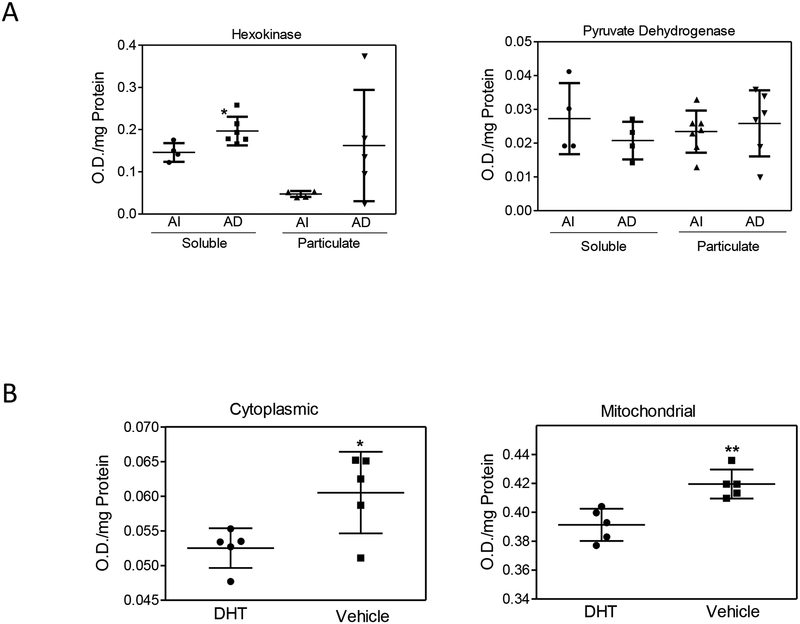
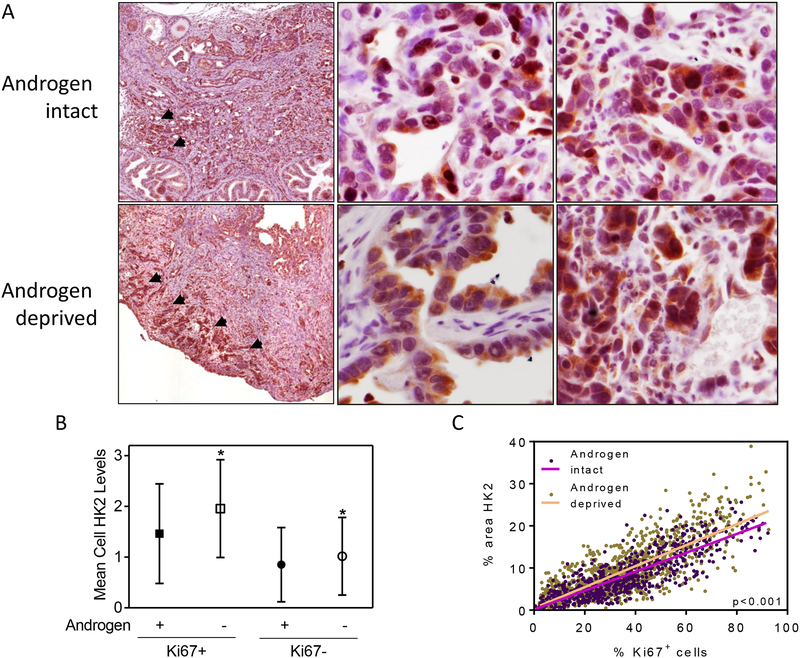
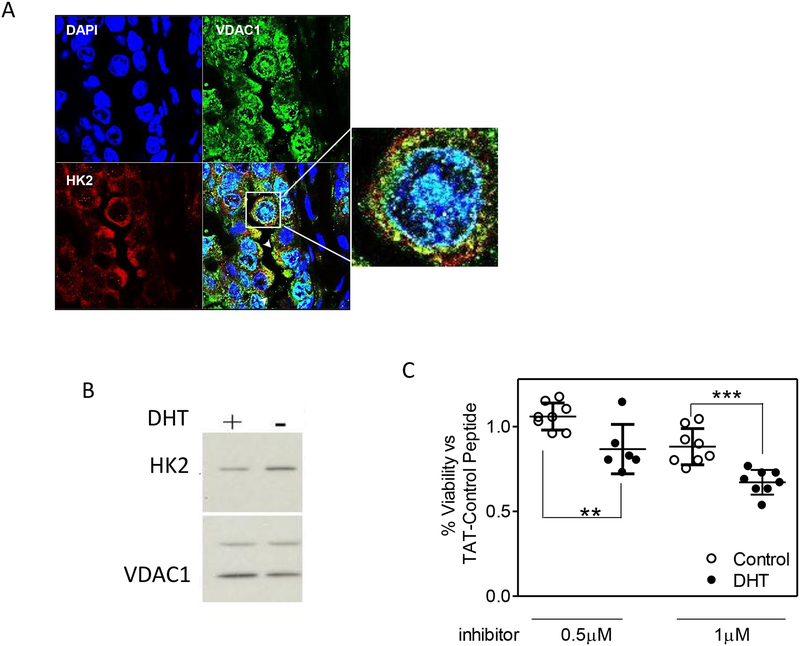
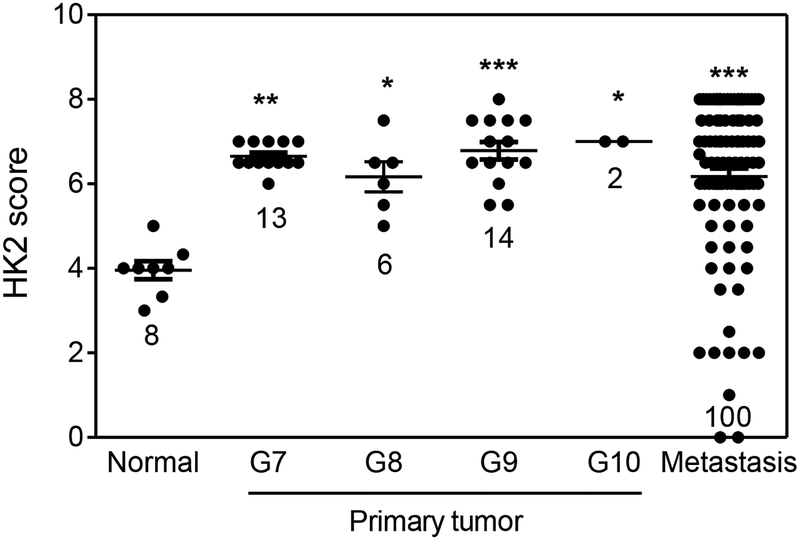
Prostate cancer is characterized by a dependence upon androgen receptor (AR) signaling, and androgen deprivation therapy (ADT) is the accepted treatment for progressive prostate cancer. Although ADT is usually initially effective, acquired resistance termed castrate-resistant prostate cancer (CRPC) develops. PTEN and TP53 are two of the most commonly deleted or mutated genes in prostate cancer, the compound loss of which is enriched in CRPC. To interrogate the metabolic alterations associated with survival following ADT, we used an orthotopic model of Pten/Tp53 null prostate cancer. Metabolite profiles and associated regulators were compared in tumors from androgen-intact mice and in tumors surviving castration. AR inhibition led to changes in the levels of glycolysis and tricarboxylic acid (TCA) cycle pathway intermediates. As anticipated for inhibitory reciprocal feedback between AR and PI3K/AKT signaling pathways, pAKT levels were increased in androgen-deprived tumors. Elevated mitochondrial hexokinase 2 (HK2) levels and enzyme activities also were observed in androgen-deprived tumors, consistent with pAKT-dependent HK2 protein induction and mitochondrial association. Competitive inhibition of HK2-mitochondrial binding in prostate cancer cells led to decreased viability. These data argue for AKT-associated HK2-mediated metabolic reprogramming and mitochondrial association in PI3K-driven prostate cancer as one survival mechanism downstream of AR inhibition.


Conflict of interest statement

Conflict of interest:

The authors declare no conflict of interest.

Figures

Figure 1.
Figure 1.
Characterizing the response to androgen deprivation in an orthotopic mouse model. A) Experimental ADT time line and tissue procurement. B) Survival rate of mice in androgen intact and deprived (5 mg cohort) groups. Data were analyzed by log-rank test. ***p<0.001. C) Representative genes regulated in Clone 1 tumors by androgen deprivation. D) Correlation analysis of primary tumor sections in androgen intact and androgen deprived groups. Sections were dual stained for Ki67 and pAKT and scored using an automated platform. n=5 mice / group. The Pearson r values are 0.59 and 0.32 for androgen intact and androgen deprived, respectively.
Figure 2.
Figure 2.
Selected metabolite quantifications for Ptenfl/fl;TP53fl/fl orthotopic prostate carcinomas growing in androgen intact or deprived male mice. Left) Heat map depicting metabolic changes in androgen deprived relative to intact orthotopic tumors for several key energetic pathways. Values indicate ratio of androgen deprived vs androgen intact groups. Significance differences (p<0.05) are indicated by colored cells. Green cells indicate a ratio <1; red cells indicate a ratio > 1; bold blue numbers indicate narrowly missed cutoff for significance; 0.05< p <0.10. Numbers of tumors analyzed for Clone 1 (5mg testosterone), Clone 1 (12.5mg testosterone), and Plum-C cohorts: intact- 7, 7, and 5 respectively, and for deprived- 6, 6, and 5, respectively. Right) Integrated model of metabolic changes in glycolysis and the tricarboxylic acid (TCA) cycle. Red indicates enhanced metabolite levels; green indicates reduced metabolite levels, and blue indicates trends narrowly missing significance as observed for at least one of the three cohorts.
Figure 3.
Figure 3.
Quantification of hexokinase activities in vivo and in vitro. A) Hexokinase (left panel) and Pyruvate Dehydrogenase (right panel) activities assayed from soluble and particulate fractions of androgen intact (AI) (n=4) and androgen deprived (AD) (n=7) tumors. B) Hexokinase enzyme activity in cytoplasmic (left panel) and mitochondrial (right panel) fractions measured from Clone1 cells treated with or without 5nM DHT for 24 hours. Data were analyzed with t-test. *p<0.05, **p<0.01
Figure 4.
Figure 4.
Quantification of HK2 expression relative to tumor cell proliferation. A) Representative dual color immunohistochemistry demonstrates HK2 (brown) and Ki67 (red) expression in androgen intact (upper panels) and androgen deprived (lower panels) tumors. The left panels are low power images from Aperio scanner, the middle panels are high HK2 expressing regions, and the right panels are lower HK2 expressing regions. B) Semi-quantitative score of cytoplasmic HK2 in Ki67 positive and negative cells comparing androgen intact (n=7) and deprived (n=6) tumor sections. For each orthotopic tumor 100 Ki67+ cells and 100 Ki67 cells were randomly chosen and scored semi-quantitatively for cytoplasmic HK2 levels (0=negative, 1=minimal/mild, 2=moderate, 3=strong). Data were analyzed by ANOVA followed by Bonferroni post test. *p<0.05. C) Correlation analysis of HK2 and Ki67 staining cells in primary tumor sections as determined using the automated Ariol™ scanning/analysis platform (n=7 for androgen intact and n=6 for deprived groups). Each dot represents a 150μm2 region of interest (ROI). Light purple and orange lines represent linear regression. p<0.001
Figure 5.
Figure 5.
Mitochondria HK2 expression in androgen intact and androgen deprived conditions. A) Representative confocal microscopy image of mitochondrial localization of HK2 (red), VDAC1(green), and DAPI-stained nuclei (blue) in a section of androgen-deprived Clone 1 tumor. B) Western blot analysis of HK2 expression in Clone 1 cells treated with or without 5 nM DHT for 24 hours. VDAC1 was used as a mitochondria loading control. C) Viability assay for Clone 1 cells grown with or without DHT for 24 hours and with the indicated concentrations of TAT-HK2 or TAT-Control peptides. Data were analyzed by t test. **p<0.01, ***p<0.001.
Figure 6.
Figure 6.
HK2 expression in human TMA samples including normal prostate, primary prostate tumors with Gleason scores ranging from 7 to 10, and metastatic prostate tumors. Each symbols represents one core. Data were analyzed by ANOVA followed by Bonferroni post test. *: p<0.05, **: p<0.01, ***: p<0.001 vs normal.

References

    1. American Cancer Society (2015). Cancer Facts and Figures 2015. http://www.cancer.org/acs/groups/content/@editorial/documents/document/a....
    1. Abou-Kheir W, Hynes PG, Martin P, Yin JJ, Liu YN, Seng V et al. Self-renewing Pten−/− TP53−/− protospheres produce metastatic adenocarcinoma cell lines with multipotent progenitor activity. PloS one 2011; 6: e26112. - PMC - PubMed
    1. Agarwal S, Hynes PG, Tillman HS, Lake R, Abou-Kheir WG, Fang L et al. Identification of Different Classes of Luminal Progenitor Cells within Prostate Tumors. Cell reports 2015. - PMC - PubMed
    1. Arora KK, Pedersen PL. Functional significance of mitochondrial bound hexokinase in tumor cell metabolism. Evidence for preferential phosphorylation of glucose by intramitochondrially generated ATP. The Journal of biological chemistry 1988; 263: 17422–17428. - PubMed
    1. Arzoine L, Zilberberg N, Ben-Romano R, Shoshan-Barmatz V. Voltage-dependent anion channel 1-based peptides interact with hexokinase to prevent its anti-apoptotic activity. The Journal of biological chemistry 2009; 284: 3946–3955. - PubMed

Publication types

MeSH terms