. 2016 Sep;57(9):1458-66.
doi: 10.1111/epi.13461. Epub 2016 Jul 4.

The SCN8A encephalopathy mutation p.Ile1327Val displays elevated sensitivity to the anticonvulsant phenytoin

Affiliations

The SCN8A encephalopathy mutation p.Ile1327Val displays elevated sensitivity to the anticonvulsant phenytoin

Bryan S Barker et al. Epilepsia. 2016 Sep.

Abstract

Objective: SCN8A encephalopathy (early infantile epileptic encephalopathy; EIEE13) is caused by gain-of-function mutations resulting in hyperactivity of the voltage-gated sodium channel Nav 1.6. The channel is concentrated at the axon initial segment (AIS) and is involved in establishing neuronal excitability. Clinical features of SCN8A encephalopathy include seizure onset between 0 and 18 months of age, intellectual disability, and developmental delay. Seizures are often refractory to treatment with standard antiepileptic drugs, and sudden unexpected death in epilepsy (SUDEP) has been reported in approximately 10% of patients. In a recent study, high doses of phenytoin were effective in four patients with SCN8A encephalopathy. In view of this observation, we have investigated the relationship between the functional effect of the SCN8A mutation p.Ile1327Val and its response to phenytoin.

Methods: The mutation was introduced into the Scn8a cDNA by site-directed mutagenesis. Channel activity was characterized in transfected ND7/23 cells. The effects of phenytoin (100 μm) on mutant and wild-type (WT) channels were compared.

Results: Channel activation parameters were shifted in a hyperpolarizing direction in the mutant channel, whereas inactivation parameters were shifted in a depolarizing direction, increasing Na channel window current. Macroscopic current decay was slowed in I1327V channels, indicating an impairment in the transition from open state to inactivated state. Channel deactivation was also delayed, allowing more channels to remain in the open state. Phenytoin (100 μm) resulted in hyperpolarized activation and inactivation curves as well as greater tonic block and use-dependent block of I1327V mutant channels relative to WT.

Significance: SCN8A - I1327V is a gain-of-function mutation with altered features that are predicted to increase neuronal excitability and seizure susceptibility. Phenytoin is an effective inhibitor of the mutant channel and may be of use in treating patients with gain-of-function mutations of SCN8A.

Keywords: Anticonvulsant drugs; Epileptic encephalopathy; Phenytoin; SCN8A; Sodium channels.


Conflict of interest statement

of Conflicts of Interest None of the authors has any conflict of interest.

Figures

Figure 1
Figure 1
I1327V modulates steady state activation. (A) Four-domain structure of the voltage-gated Na channel α subunit shows that I1327V is located at the cytosolic interface of the S4–S5 linker and transmembrane segment 5 of domain III. (B) Representative traces of families of Na currents recorded from ND7/23 cells transfected with the indicated Nav1.6 cDNAs. (C) Averaged current-voltage (I-V) relationship for cells expressing WT and I1327V. Peak currents were normalized to cell capacitance. (D) Voltage dependence of channel activation. Smooth lines correspond to the least squares fit when average data were fit to a single Boltzmann equation. (E) Scatter plot of voltage at half-maximal activation (V1/2) for cells expressing WT and I1327V. (F) Scatter plot of the slope factor of activation (k). (G) Average fast time constants obtained from single exponential fits to macroscopic current decays as a function of voltage. (H) Representative traces of normalized currents evoked by a +35 mV stimulus from a holding potential of −120 mV illustrate delays in macroscopic current decay between WT (black) and I1327V (red). Data are means ± S.E.M. Statistical significance: * P <0.05; ** P<0.005. Black circles, WT; red triangles, I1327V.
Figure 2
Figure 2
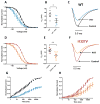
I1327V disrupts channel inactivation properties. (A) Average fast time constant obtained from single exponential fits to deactivation of WT and I1327V channels. (B) Voltage dependence of steady-state inactivation. Smooth lines correspond to the least squares fit when average data were fit to a single Boltzmann equation. (C) Scatter plot of voltage at half-maximal inactivation (V1/2) for cells expressing WT and I1327V (D) Scatter plot of the slope factor (k) of inactivation. (E) The window current is obtained by overlapping the normalized activation and inactivation curves from WT and I1327V cells. (F) Enhanced view of overlapping activation and inactivation curves shows an increase in I1327V window current (red shaded area) compared to WT (gray shaded area). G) Recovery from inactivation at a post train level of −90 mV. Data are means ± S.E.M. Statistical significance: * P <0.05; ** P<0.005. Black circles, WT; red triangles, I1327V.
Figure 3
Figure 3
Phenytoin (PHT) inhibits Na channel currents evoked from WT and I1327V and modulates steady-state activation parameters. (A) Scatter plot showing normalized macroscopic current amplitude remaining following tonic block by phenytoin (100 μM). Currents were elicited by a depolarizing step to 0 mV for 12 ms from a holding potential of −60 mV. (B) Representative traces show greater tonic inhibition of I1327V currents over WT currents by phenytoin (100 μM) (C) Use-dependent block by phenytoin (100 μM). Cells were held at −120 mV and a voltage step to +20 mV was applied for 20 ms at a frequency of 10 Hz. (D) Shift in the voltage dependence of WT channel activation following treatment with phenytoin (100 μM). Smooth lines correspond to the least squares fit when average data were fit to a single Boltzmann equation. (E) Scatter plot of voltage at half-maximal activation (V1/2) (F) Shift in the voltage dependence of I1327V channel activation following treatment with phenytoin (100 μM). Smooth lines correspond to the least squares fit when average data were fit to a single Boltzmann equation. (G) Scatter plot of voltage at half-maximal activation (V1/2). Data are means ± S.E.M. Statistical significance: *P <0.05. Black filled circles, WT; blue open circles, WT + phenytoin, red filled triangles, I1327V; orange open triangles, I1327V + phenytoin.
Figure 4
Figure 4
Phenytoin (PHT) modulates steady state inactivation properties in cells expressing WT and I1327V channels. (A) Shift in the voltage dependence of WT channel inactivation following treatment with phenytoin (100 μM). Smooth lines correspond to the least squares fit when average data were fit to a single Boltzmann equation. (B) Scatter plot of voltage at half-maximal inactivation (V1/2). (C) Representative WT traces elicited following a pre-pulse to −75 mV demonstrating the shift in inactivation following application of phenytoin (100 μM). Traces were normalized to the pre-phenytoin peak current. (D) Shift in the voltage dependence of I1327V channel inactivation following treatment with phenytoin (100 μM). Smooth lines correspond to the least squares fit when average data were fit to a single Boltzmann equation. (E) Scatter plot of voltage at half-maximal inactivation (V1/2). (F) Representative I1327V traces following a pre-pulse to −75 mV demonstrating the shift in inactivation following the application of phenytoin (100 μM). Recovery from inactivation before and after the application of phenytoin (100 μM) in WT (G) and I1327V (H) cells. Data are means ± S.E.M. Statistical significance *P <0.05; **P<0.005. Black filled circles, WT; blue open circles, WT + phenytoin; red filled triangles, I1327V; orange open triangles, I1327V + phenytoin.

References

    1. Cooper DC, Chung S, Spruston N. Output-mode transitions are controlled by prolonged inactivation of sodium channels in pyramidal neurons of subiculum. PLoS Biol. 2005;3:e175. - PMC - PubMed
    1. Vreugdenhil M, Hoogland G, van Veelen CW, et al. Persistent sodium current in subicular neurons isolated from patients with temporal lobe epilepsy. Eur J Neurosci. 2004;19:2769–2778. - PubMed
    1. Wagnon JL, Meisler MH. Recurrent and Non-Recurrent Mutations of SCN8A in Epileptic Encephalopathy. Front Neurol. 2015;6:104. - PMC - PubMed
    1. Blumenfeld H, Lampert A, Klein JP, et al. Role of hippocampal sodium channel Nav1. 6 in kindling epileptogenesis. Epilepsia. 2009;50:44–55. - PMC - PubMed
    1. Hargus NJ, Merrick EC, Nigam A, et al. Temporal lobe epilepsy induces intrinsic alterations in Na channel gating in layer II medial entorhinal cortex neurons. Neurobiol Dis. 2011;41:361–376. - PMC - PubMed

Publication types

MeSH terms

Associated data