. 2016 Jun 9:10:252.
doi: 10.3389/fnins.2016.00252. eCollection 2016.

Shielded Coaxial Optrode Arrays for Neurophysiology

Affiliations

Shielded Coaxial Optrode Arrays for Neurophysiology

Jeffrey R Naughton et al. Front Neurosci. .

Abstract

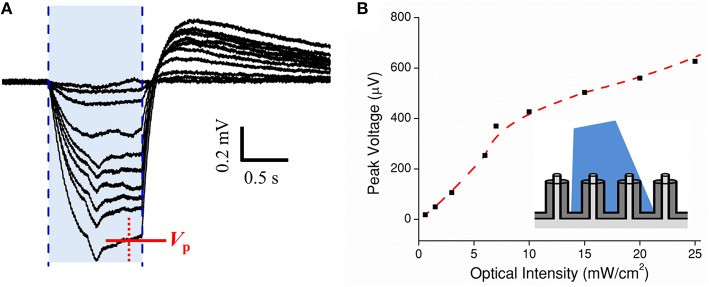
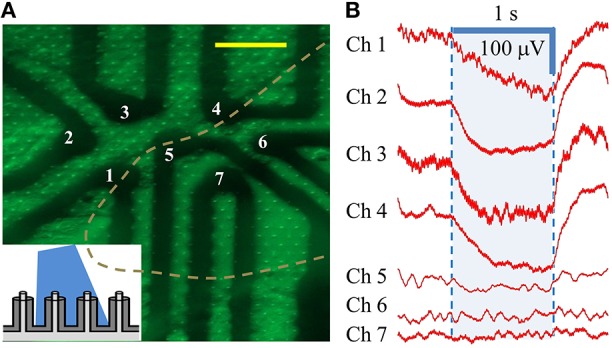
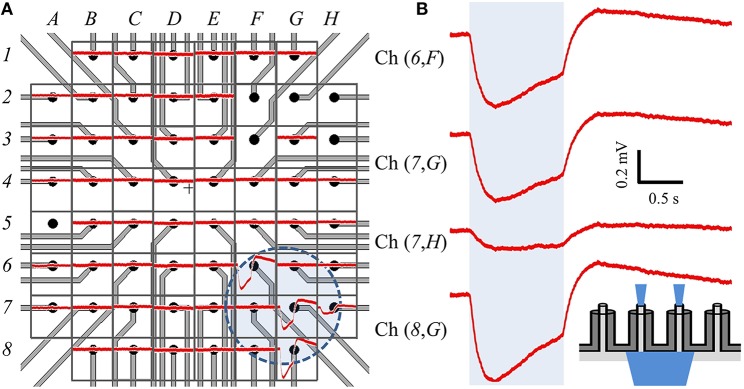
Recent progress in the study of the brain has been greatly facilitated by the development of new tools capable of minimally-invasive, robust coupling to neuronal assemblies. Two prominent examples are the microelectrode array (MEA), which enables electrical signals from large numbers of neurons to be detected and spatiotemporally correlated, and optogenetics, which enables the electrical activity of cells to be controlled with light. In the former case, high spatial density is desirable but, as electrode arrays evolve toward higher density and thus smaller pitch, electrical crosstalk increases. In the latter, finer control over light input is desirable, to enable improved studies of neuroelectronic pathways emanating from specific cell stimulation. Here, we introduce a coaxial electrode architecture that is uniquely suited to address these issues, as it can simultaneously be utilized as an optical waveguide and a shielded electrode in dense arrays. Using optogenetically-transfected cells on a coaxial MEA, we demonstrate the utility of the architecture by recording cellular currents evoked from optical stimulation. We also show the capability for network recording by radiating an area of seven individually-addressed coaxial electrode regions with cultured cells covering a section of the extent.

Keywords: extracellular; multielectrode array; nanotechnology; neuroelectronic; optogenetics; optrode.


Figures

Figure 1
Figure 1
Simulation of electric potential profile. (A) Equipotential contours for bare (unshielded) electrodes, 5 μm tall and 10 μm apart, biased at 100 μV (ground at infinity). Scale bar: 5 μm. (B) Electrodes with ground shield 25% the height of the biased core (1.25 μm). (C) Electrodes with shield 85% the height of the biased core (4.25 μm). Dark red represents areas where >95% of the signal from a source (e.g., action potential/neuron spike) would be seen by the electrode while dark blue represents areas where <20% of the signal would be seen. As the shield progresses in height, overlapping areas shrink and result in discretized electrodes, and thus reduced electrical crosstalk. (D) Plots of electric potential vs. lateral position for the three cases shown, for two constant heights above the core tips, 50 nm and 1 μm, and scaled to the core potential, further demonstrating the virtue of the shielded architecture: bare electrodes only negligibly resolve the spatial variation of V/V(core), while the shielded coaxes in (C) show clear discrimination.
Figure 2
Figure 2
Coaxial electrode array. (A) Coaxial microelectrode array (cMEA) on glass substrate. Scale bar: 10 mm. (B) Optical micrograph showing cMEA sensing areas. Gray lines are Cr (shield) address lines, yellow lines are Au (core) address lines, and circular overlapping areas are the coaxial sensing areas. Small dots throughout image are the underlying pillar array. Scale bar: 100 μm. (C) Top view SEM image of a single coax in a coaxial nanoelectrode array (cNEA). Scale bar: 200 nm (D), (E) 30° tilted view SEM images of nanoelectrode (scale bar: 200 nm) and microelectrode (scale bar: 2 μm) coaxial array architectures, respectively.
Figure 3
Figure 3
Characterization of device. Impedance measured as a function of frequency for an individual coaxial sensing region for the cMEA (solid squares) and the cNEA (solid circles). Lines are guides to the eye. Related devices found in the literature are included for comparison.
Figure 4
Figure 4
Extracellular recording of dissociated leech neurons mechanically placed on top of coaxial sensing region of a cNEA. (A) Schematic of ganglion sac placement onto an individual sensing region within the device. (B) Spontaneous bursts during 60 s recording. Scale bars: 400 μV/10 s (C) One waveform type found within burst. (D) Second waveform resembling extracellular action potential found during post-recording spike sorting analysis. (E,F) Closer looks at two distinct waveforms extracted during post-analysis spike sorting. Scale bars, upper right: 50 μV/10 ms, lower right: 200 μV/3 ms.
Figure 5
Figure 5
Dose test of optogenetic HEK-ChR2 cells cultured onto a cMEA. (A) Dose test during top side illumination (473 nm) of HEK-ChR2 cells cultured onto a cMEA. The shaded blue region indicates the light-on times and the red arrow indicates the time at which peak voltage was determined (signal having reached a local steady state). (B) Peak voltage as a function of power density with parametrically fitted line to guide the eye. Inset depicts light-from-above configuration.
Figure 6
Figure 6
Individually-addressed coaxial sensing regions in cMEA. (A) Fluorescent microscope image of HEK-ChR2 cells covering a portion (in area left of dashed line) of 7 individually-addressed coaxial regions, each containing 8 coaxes. Inset depicts light-from-above configuration. Scale bar: 50 μm. (B) Electrical response (changes in LFP) of HEK-ChR2 cells to optical stimulation in the 7 sensing regions (473 nm wavelength; 20 mW/cm2). Shaded region denotes light-on times.
Figure 7
Figure 7
Backside stimulation of HEK-ChR2 cells cultured on cMEA. (A) Layout of cMEA chip having 60 coaxial sensing regions, with recorded data overlain. The sensing regions are 20 μm in diameter at 100 μm pitch. The (number, letter) combinations correspond to (row, column) recording channels. The voltage response to optical illumination (at 473 nm) for each region is plotted in red. Regions without data curves had non-working inputs on the measurement amplifier. The shaded circle in the lower right centered near (7,G) indicates the illuminated area for this particular experiment. (B) Expanded views of signals from four regions within illuminated area, showing clear voltage deflections due to optical stimulus. Shaded region represents light-on times. Inset depicts light-from-below configuration. That is, light is input from below the array, passes through the coax cores, and stimulates cells above the array.

References

    1. Anikeeva P., Andalman A. S., Witten I., Warden M., Goshen I., Grosenick L., et al. . (2012). Optetrode: a multichannel readout for optogenetic control in freely moving mice. Nat. Neurosci. 15, 163–170. 10.1038/nn.2992 - DOI - PMC - PubMed
    1. Archibald M. M., Rizal B., Connolly T., Burns M. J., Naughton M. J., Chiles T. C. (2015). A nanocoaxial-based electrochemical sensor for the detection of cholera toxin. Biosens. Bioelectron. 74, 406–410. 10.1016/j.bios.2015.06.069 - DOI - PMC - PubMed
    1. AzimiHashemi N. K., Erbguth A., Vogt T., Riemensperger E., Rauch D., Nagpal J., et al. . (2014). Synthetic retinal analogues modify the spectral and kinetic characteristics of microbial rhodopsin optogenetic tools. Nat. Commun. 5:5810. 10.1038/ncomms6810 - DOI - PubMed
    1. Bakkum D. J., Frey U., Radivojevic M., Russell T. L., Müller J., Fiscella M., et al. . (2013). Tracking axonal action potential propagation on a high-density microelectrode array across hundreds of sites. Nat. Commun. 4:2181. 10.1038/ncomms3181 - DOI - PMC - PubMed
    1. Ballini M., Muller J., Livi P., Chen Y., Frey U., Stettler A., et al. (2014). A 1024-Channel CMOS microelectrode array with 26,400 electrodes for recording and stimulation of electrogenic cells in vitro. IEEE J. Solid State Circuits 49, 2705–2719. 10.1109/JSSC.2014.2359219 - DOI - PMC - PubMed

LinkOut - more resources