

Resting State Functional Connectivity MRI among Spectral MEG Current Sources in Children on the Autism Spectrum
- PMID: 27375419
- PMCID: PMC4899470
- DOI: 10.3389/fnins.2016.00258
Resting State Functional Connectivity MRI among Spectral MEG Current Sources in Children on the Autism Spectrum
Abstract
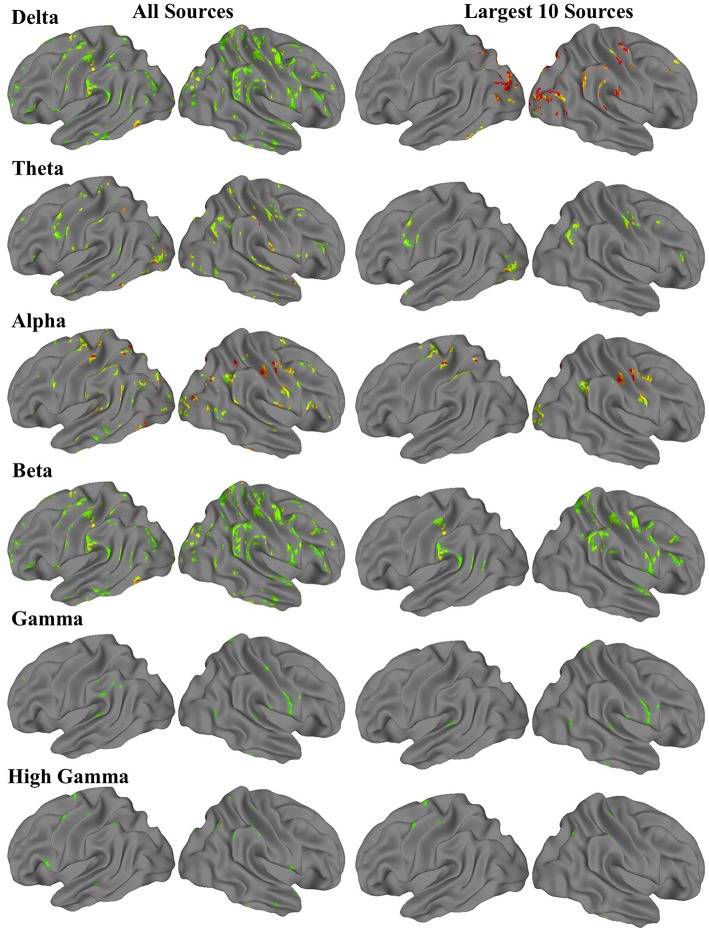
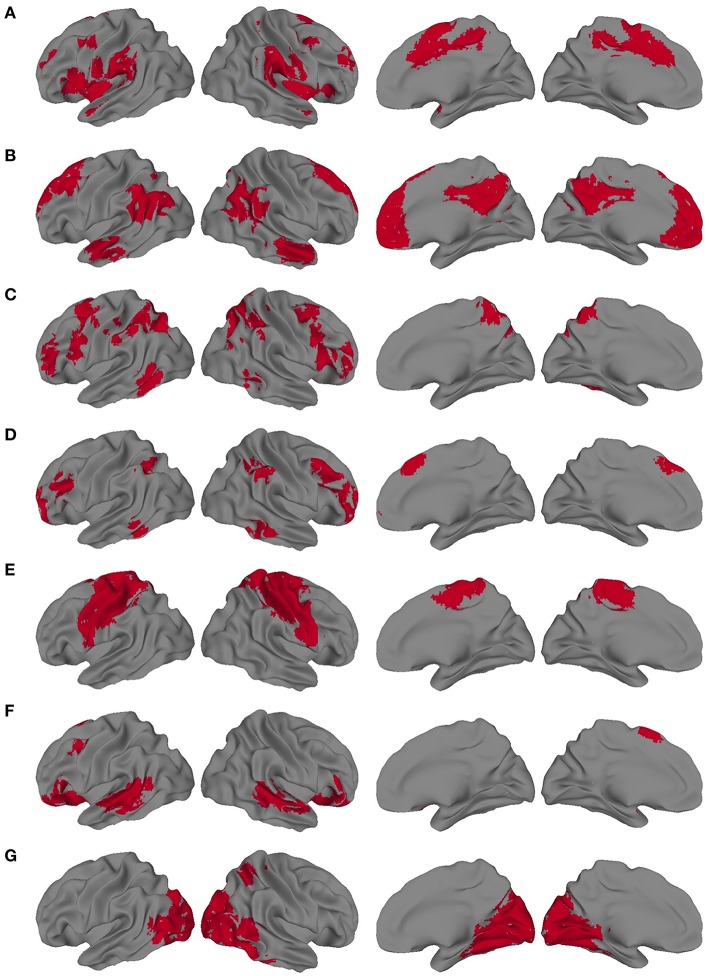
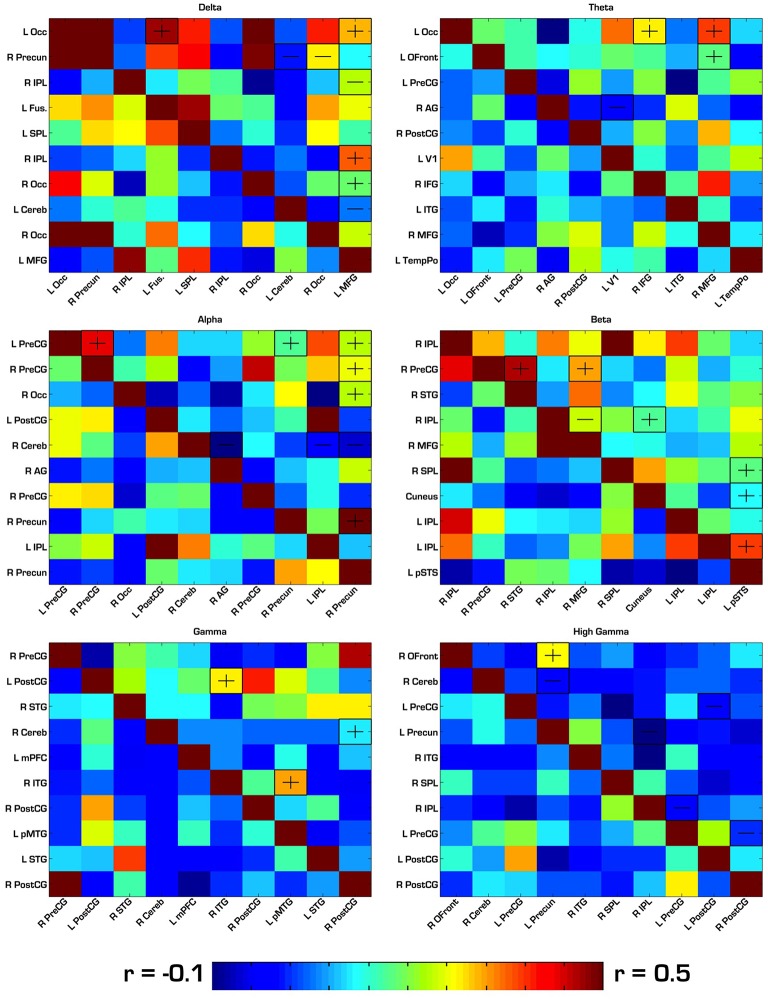
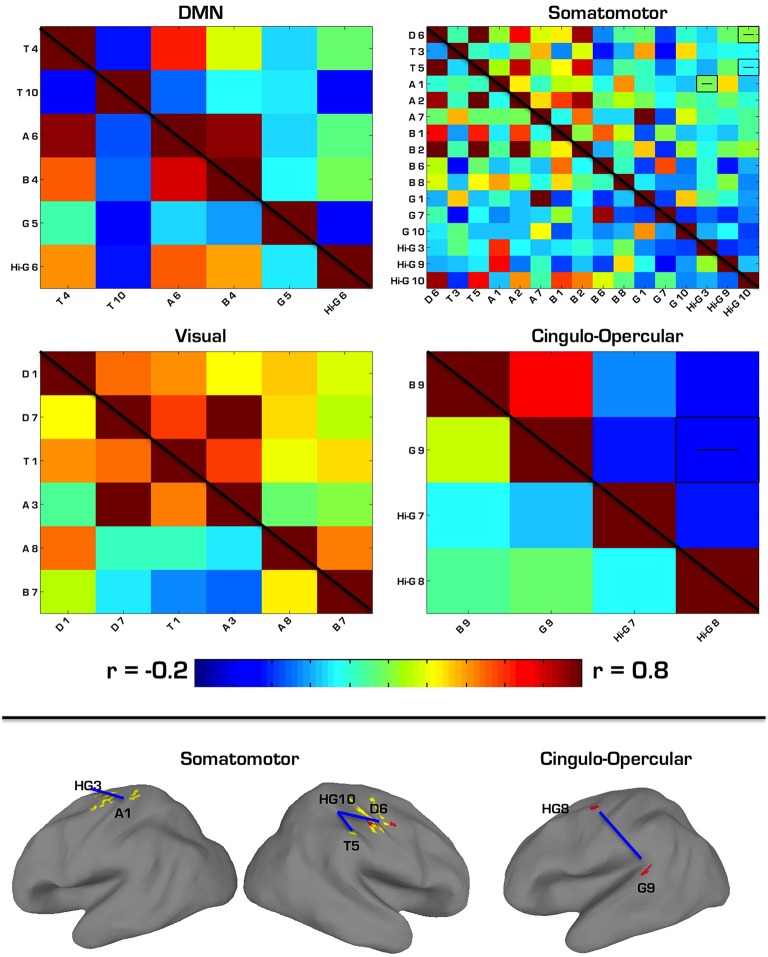
Social and communicative impairments are among the core symptoms of autism spectrum disorders (ASD), and a great deal of evidence supports the notion that these impairments are associated with aberrant functioning and connectivity of various cortical networks. The present study explored the links between sources of MEG amplitude in various frequency bands and functional connectivity MRI in the resting state. The goal of combining these modalities was to use sources of neural oscillatory activity, measured with MEG, as functionally relevant seed regions for a more traditional pairwise fMRI connectivity analysis. We performed a seed-based connectivity analysis on resting state fMRI data, using seed regions derived from frequency-specific amplitude sources in resting state MEG data in the same nine subjects with ASD (10-17 years of age). We then compared fMRI connectivity among these MEG-source-derived regions between participants with autism and typically developing, age-matched controls. We used a source modeling technique designed for MEG data to detect significant amplitude sources in six frequency bands: delta (2-4 Hz), theta (4-8 Hz), alpha (8-12 Hz), beta (12-30 Hz), low gamma (30-60 Hz), and high gamma (60-120 Hz). MEG-derived source maps for each participant were co-registered in standard MNI space, and group-level source maps were obtained for each frequency. For each frequency band, the 10 largest clusters resulting from these t-tests were used as regions of interest (ROIs) for the fMRI functional connectivity analysis. Pairwise BOLD signal correlations were obtained between each pair of these ROIs for each frequency band. Each pairwise correlation was compared between the ASD and TD groups using t-tests. We also constrained these pairwise correlations to known network structures, resulting in a follow-up set of correlation matrices specific to each network we considered. Frequency-specific MEG sources had distinct patterns of fMRI resting state functional connectivity in the ASD group, but perhaps the most significant was a finding of hypoconnectivity between many sources of low and high gamma activity. These novel findings suggest that in ASD there are differences in functionally defined networks as shown in previous fMRI studies, as well as between sets of regions defined by magnetoencephalographic neural oscillatory activity.
Keywords: autism; fMRI; functional connectivity; magnetoencephalography; multimodal.
Figures
Similar articles
-
Atypical resting synchrony in autism spectrum disorder.Hum Brain Mapp. 2014 Dec;35(12):6049-66. doi: 10.1002/hbm.22604. Epub 2014 Aug 13. Hum Brain Mapp. 2014. PMID: 25116896 Free PMC article.
-
Patterns of altered neural synchrony in the default mode network in autism spectrum disorder revealed with magnetoencephalography (MEG): Relationship to clinical symptomatology.Autism Res. 2018 Mar;11(3):434-449. doi: 10.1002/aur.1908. Epub 2017 Dec 18. Autism Res. 2018. PMID: 29251830
-
Graph theoretical analysis of resting-state MEG data: Identifying interhemispheric connectivity and the default mode.Neuroimage. 2014 Aug 1;96:88-94. doi: 10.1016/j.neuroimage.2014.03.065. Epub 2014 Mar 31. Neuroimage. 2014. PMID: 24699016 Free PMC article.
-
Alterations of Intrinsic Brain Connectivity Patterns in Depression and Bipolar Disorders: A Critical Assessment of Magnetoencephalography-Based Evidence.Front Psychiatry. 2017 Mar 17;8:41. doi: 10.3389/fpsyt.2017.00041. eCollection 2017. Front Psychiatry. 2017. PMID: 28367127 Free PMC article. Review.
-
Presurgical Evaluation of Epilepsy Using Resting-State MEG Functional Connectivity.Front Hum Neurosci. 2021 Jul 2;15:649074. doi: 10.3389/fnhum.2021.649074. eCollection 2021. Front Hum Neurosci. 2021. PMID: 34276321 Free PMC article. Review.
Cited by
-
Atypical cortical networks in children at high-genetic risk of psychiatric and neurodevelopmental disorders.Neuropsychopharmacology. 2024 Jan;49(2):368-376. doi: 10.1038/s41386-023-01628-x. Epub 2023 Jul 4. Neuropsychopharmacology. 2024. PMID: 37402765 Free PMC article.
-
New Assessments and Treatments in ASD.Curr Treat Options Neurol. 2017 Feb;19(2):6. doi: 10.1007/s11940-017-0443-8. Curr Treat Options Neurol. 2017. PMID: 28251588 Review.
-
Prospects for Future Methodological Development and Application of Magnetoencephalography Devices in Psychiatry.Front Psychiatry. 2020 Aug 21;11:863. doi: 10.3389/fpsyt.2020.00863. eCollection 2020. Front Psychiatry. 2020. PMID: 32973591 Free PMC article.
-
Early alterations of social brain networks in young children with autism.Elife. 2018 Feb 27;7:e31670. doi: 10.7554/eLife.31670. Elife. 2018. PMID: 29482718 Free PMC article.
References
-
- American Psychiatric Association (APA) (2013). Diagnostic and Statistical Manual of Mental Disorders, 5th Edn. Arlington, VA: American Psychiatric Association.
-
- Andersson J. L. R., Jenkinson M., Smith S. (2007). Non-Linear Registration, Aka Spatial Normalisation FMRIB Technical Report TR07JA2. FMRIB Analysis Group of the University of Oxford.
-
- Barttfeld P., Wicker B., Cukier S., Navarta S., Lew S., Sigman M. (2011). A big-world network in ASD: dynamical connectivity analysis reflects a deficit in long-range connections and an excess of short-range connections. Neuropsychologia 49, 254–263. 10.1016/j.neuropsychologia.2010.11.024 - DOI - PubMed
LinkOut - more resources
Full Text Sources
Other Literature Sources