. 2016 Jun 10:10:106.
doi: 10.3389/fnbeh.2016.00106. eCollection 2016.

Analysis of Individual Mouse Activity in Group Housed Animals of Different Inbred Strains using a Novel Automated Home Cage Analysis System

Affiliations

Analysis of Individual Mouse Activity in Group Housed Animals of Different Inbred Strains using a Novel Automated Home Cage Analysis System

Rasneer S Bains et al. Front Behav Neurosci. .

Abstract

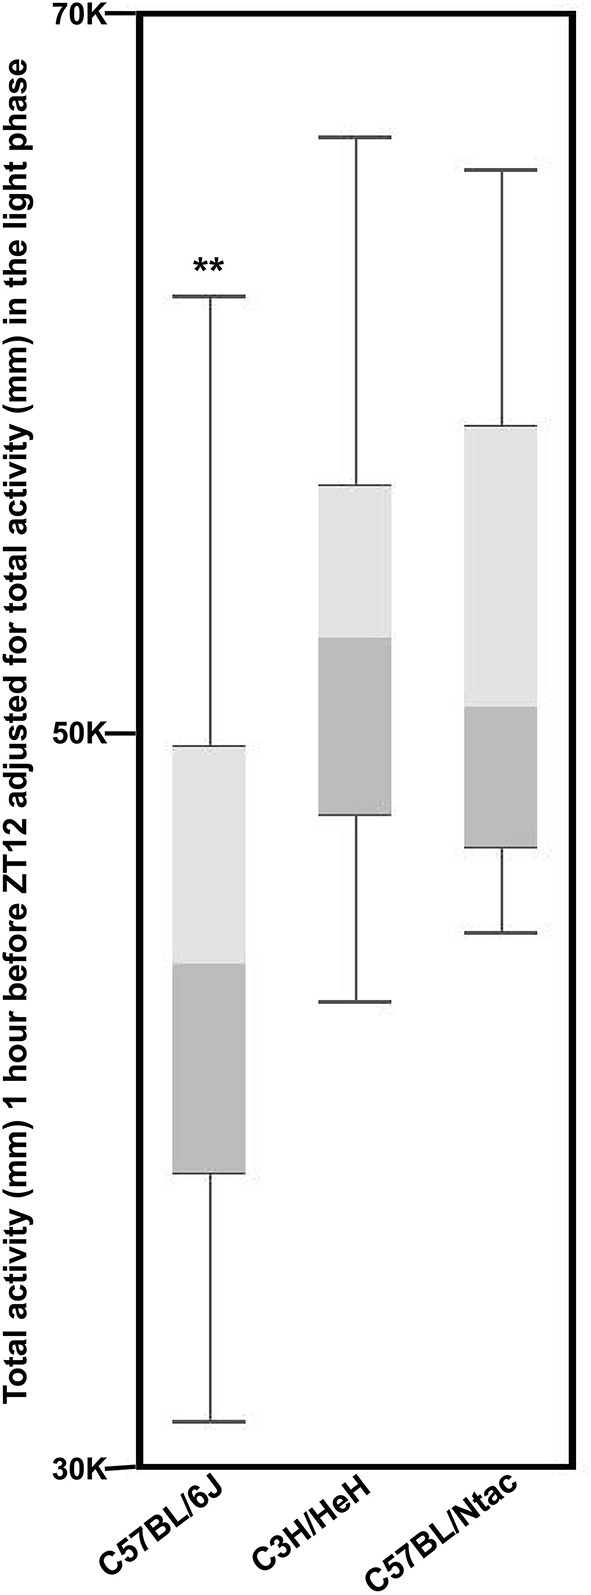
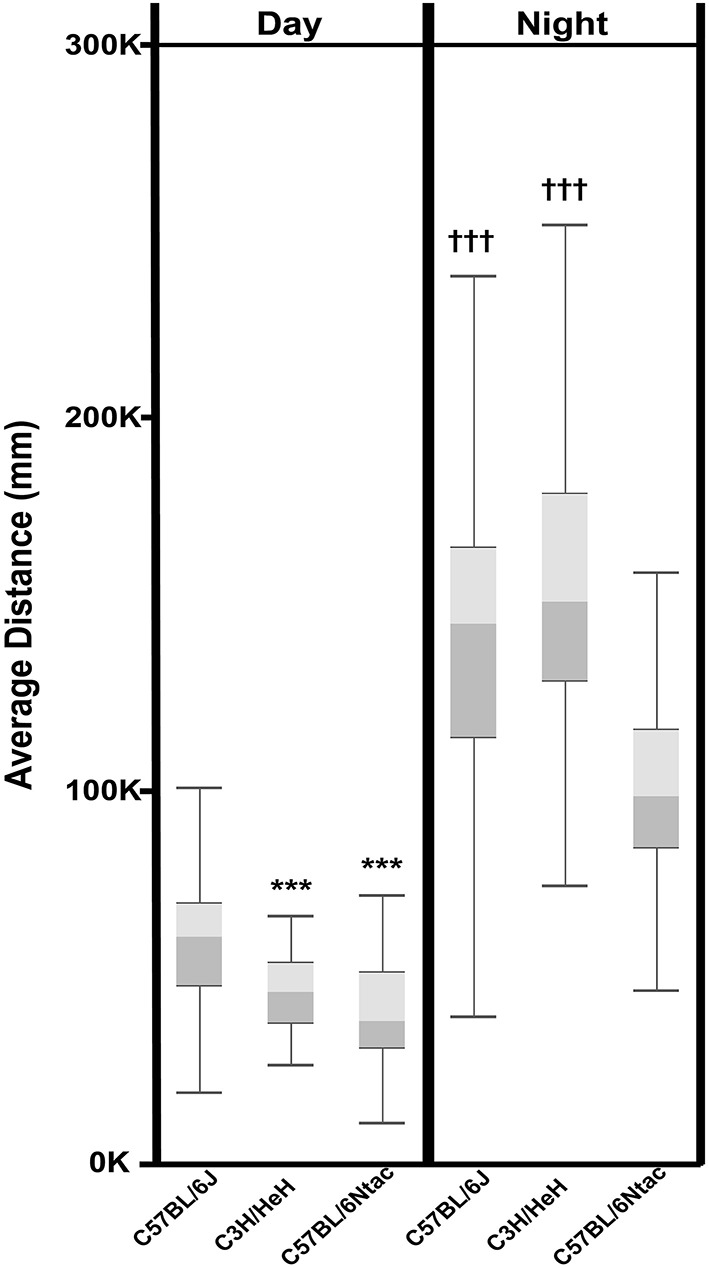
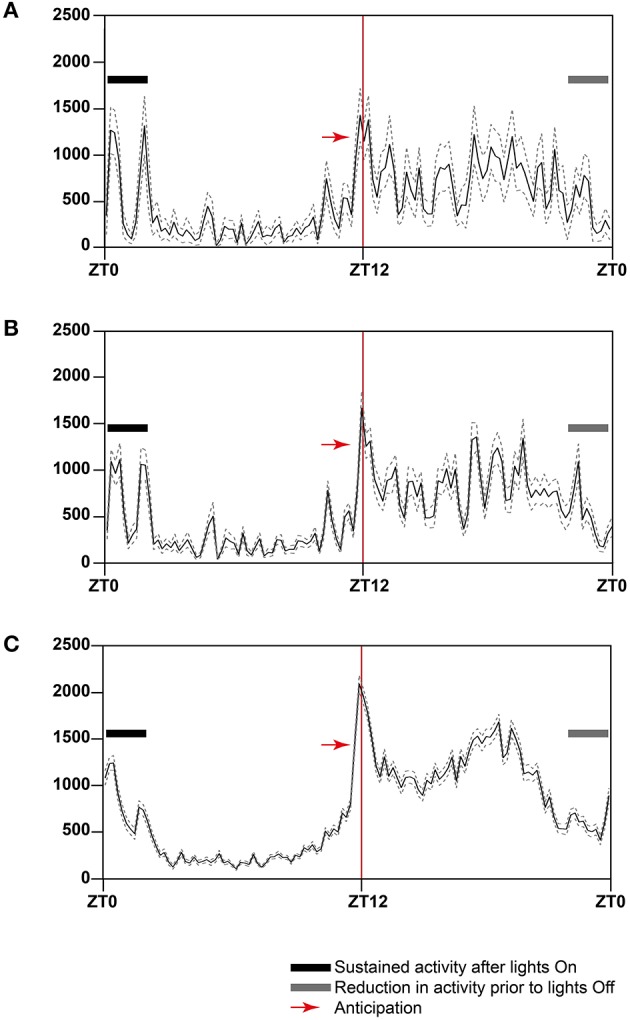
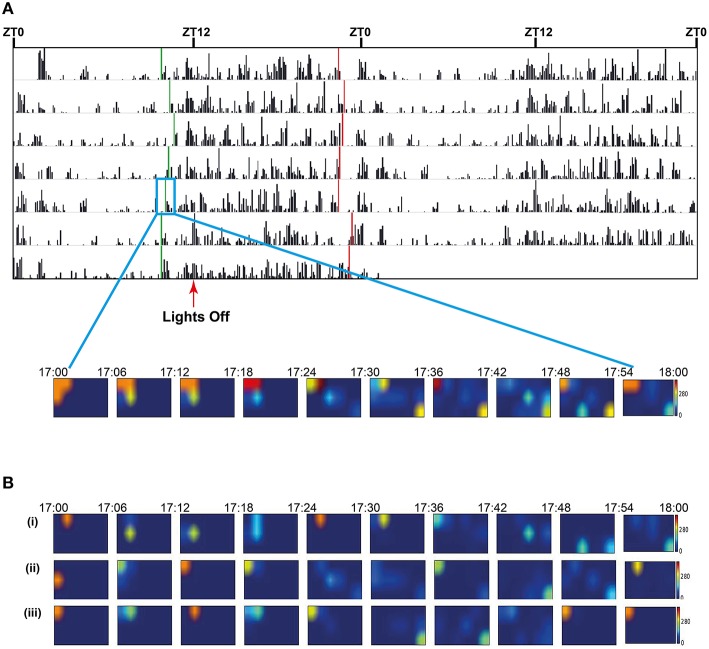
Central nervous system disorders such as autism as well as the range of neurodegenerative diseases such as Huntington's disease are commonly investigated using genetically altered mouse models. The current system for characterizing these mice usually involves removing the animals from their home-cage environment and placing them into novel environments where they undergo a battery of tests measuring a range of behavioral and physical phenotypes. These tests are often only conducted for short periods of times in social isolation. However, human manifestations of such disorders are often characterized by multiple phenotypes, presented over long periods of time and leading to significant social impacts. Here, we have developed a system which will allow the automated monitoring of individual mice housed socially in the cage they are reared and housed in, within established social groups and over long periods of time. We demonstrate that the system accurately reports individual locomotor behavior within the group and that the measurements taken can provide unique insights into the effects of genetic background on individual and group behavior not previously recognized.

Keywords: C57BL/6 mice; circadian rhythm; inbred mouse strains; mouse behavior; mouse models; strain differences.


Figures

Figure 1
Figure 1
Illustration of the Home Cage Analysis system with major components highlighted. The frame shown in the illustration varies according to the rack into which it is installed.
Figure 2
Figure 2
(A) Top down view of a baseplate with the manual traces of the animals overlaid. The center point of each RFID antenna is indicated (open orange circle). As the baseplate reads each location as the center of the antenna, the measurements will, on average, underestimate distance moved but with a strong correlation (Spearman's rank coefficient ρ = 0.940, p = 6.52 × 10⁻¹⁹, N = 39) (B) The correlation between the actual distance moved and distance estimated by readings from the RFID baseplate. Each point plotted is a single animal recorded and tracked for 6 min. Equality and linear regression lines are shown.
Figure 3
Figure 3
Activity data from one representative cage of C57BL/6J displayed as a raster plot of the sum of the total distance traveled in millimeter (mm) in 6 min time bins, over 7 consecutive days in standard 12 h light/dark cycles. The raster plot is double-plotted on a 24 h cycle with the shaded area representing the dark phase. (A) Sum of distance traveled by a cage of three animals (scale 20,000 mm) (B) Sum of distance traveled by individual animals (i), (ii), and (iii) in the cage represented in A (Scale 10,000 mm) (C) Representative example of wheel running in singly-housed C57BL/6J male mouse displayed as a raster plot double-plotted on a 24 h cycle as above where the activity is represented as average counts of wheel rotations in 6 min time bins. Red circles highlight the first bout of activity resulting as a consequence of moving the home cage from its holding IVC rack to the experimental rack. The red arrows highlight activity detected from dawn (ZT0) in the HCA system but not evident using the wheel running-based system.
Figure 4
Figure 4
Activity data for a representative individual mouse from a cage of three (A) C57BL/6J (scale 10,000 mm), (B) C57BL/6Ntac (Scale 6500 mm), and (C) C3H/HeH (scale 6500 mm) displayed a raster plot of the total distance traveled in millimeter (mm) in 6 min time bins, over 7 consecutive days in standard 12 h light/dark cycles. The raster plot is double-plotted on a 24 h cycle with the shaded area representing the dark phase. Red circles highlight the first bout of activity resulting as a consequence of moving the home cage from its holding IVC rack to the experimental rack. The red arrows highlight strain differences in activity detected from dawn (ZT0) using the HCA system.
Figure 5
Figure 5
The sum of activity for three strains (n = 54 total) between 18:00 and 19:00 h for 7 days fitted to sum of day time activity for the whole week displayed as a Box and Whisker plot. Whiskers refer to the data within 1.5 times the interquartile range, the boxes represent the 1st and 3rd quartile around the median. Data were analyzed using Analysis of Variance followed by Post-hoc Tukey's test. The results show that: The anticipatory activity of C57BL/6J mice is significantly (**p > 0.01) lower than C57BL/6Ntac mice, but no differences were found between C3H/HeH mice and the other two strains.
Figure 6
Figure 6
Total day time and night time activity for three strains displayed as a Box and Whisker plot. Whiskers refer to the data within 1.5 times the interquartile range, the boxes represent the 1st and 3rd quartile around the median. Data were analyzed using Analysis of Variance followed by Post-hoc Tukey's test. The results show that: Total Day Time activity for C3H/HeH and C57BL/6Ntac is significantly lower (***p < 0.0001) than that for C57BL/6J. Total Night Time activity for C3H/HeH and C57BL/6J is significantly higher (†††p < 0.0001) than that for C57BL/6Ntac (p < 0.0001).
Figure 7
Figure 7
Twenty-four-hour activity averages over a 7 day period for (A) one C3H/HeH mouse, (B) a cage of three C3H/HeH mice (n = 3), and (C) all C3H/HeH mice recorded (n = 15). The data was plotted in 12 min time bins, represented by the solid line, the dotted lines represent the average ± standard error of mean (SEM). The Y-axis is average total distance measured in mm; the X-axis represents the zeitgeber time (ZT), where ZT0 is lights on. The red line at ZT12 indicates where lights are switched off at the beginning of the dark phase. The black bar indicates the period of sustained activity after lights on and the gray bar indicates a period of reduced activity prior to lights on.
Figure 8
Figure 8
(A) Seven day double-plotted actogram for a single animal in a cage of 3, with automatically calculated onset and offset times (green and red vertical bars respectively) indicating activity-related anticipation of the dark and light phases. For the three animals over 7 days in the cage the mean anticipation was 85 min (st dev 36) for lights off and 75 (st dev 38) for lights on. The insert shows a heatmap plot of mean location of the three animals in the cage during the onset period. Prior to onset the individuals are socially clustered in one corner of the cage but, as the time bin representing the activity onset approaches, the mice become more active and mean locations are spread throughout the cage. Each image in the heatmap represents a 6 min bin of locations with the mid-point of the series coinciding with the calculated on-set time (green bar in the box of day 5). (B) Heatmap plots of mean location of each of the three animals (i), (ii), and (iii) in the cage during the onset period. Each image in the heatmap represents a 6 min bin of locations with the mid-point of the series coinciding with the calculated on-set time (green bar in the box of day 5). The actogram in (A) represents the activity of animal (i).

References

    1. Banks G. T., Nolan P. N. (2011). Assessment of circadian and light-entrainable parameters in mice using wheel-running activity. Curr. Prot. Mouse Biol. 1, 369–381. 10.1002/9780470942390.mo110123 - DOI - PubMed
    1. Bartolomucci A., Palanza P., Parmigiani S., Pederzani T., Merlot E., Neveu P. J., et al. . (2003). Chronic psychosocial stress down-regulates central cytokines mRNA. Brain Res. Bull. 62, 173–178. 10.1016/j.brainresbull.2003.09.009 - DOI - PubMed
    1. Bate S. T., Clark R. A. (2014). The Design and Statistical Analysis of Animal Experiments. Cambridge, UK: Cambridge University Press.
    1. Bibancos T., Jardim D. L., Aneas I., Chiavegatto S. (2007). Social isolation and expression of serotonergic neurotransmission-related genes in several brain areas of male mice. Genes Brain Behav. 6, 529–539. 10.1111/j.1601-183X.2006.00280.x - DOI - PubMed
    1. Brooks S., Higgs G., Jones L., Dunnett S. B. (2012). Longitudinal analysis of the behavioural phenotype in Hdh(CAG)150 Huntington's disease knock-in mice. Brain Res. Bull. 88, 182–188. 10.1016/j.brainresbull.2010.05.004 - DOI - PubMed