. 2016 Jun 6:10:270.
doi: 10.3389/fnhum.2016.00270. eCollection 2016.

Change in Mean Frequency of Resting-State Electroencephalography after Transcranial Direct Current Stimulation

Affiliations

Change in Mean Frequency of Resting-State Electroencephalography after Transcranial Direct Current Stimulation

Tjeerd W Boonstra et al. Front Hum Neurosci. .

Abstract

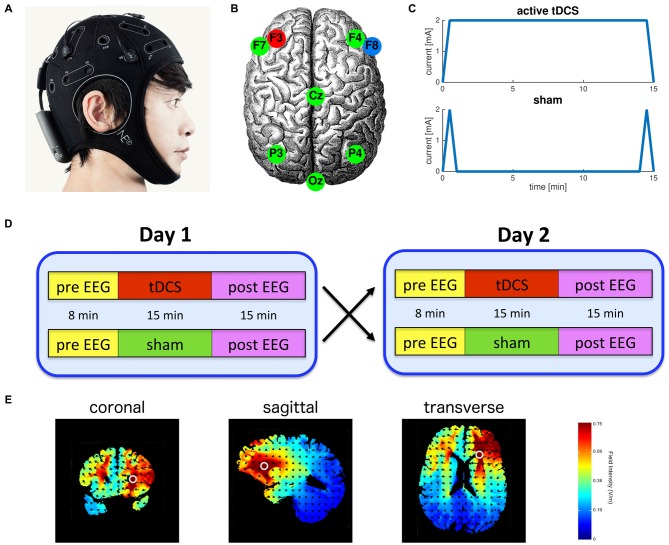
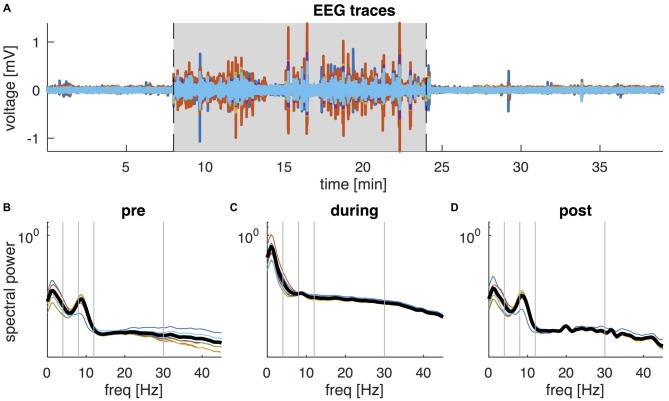
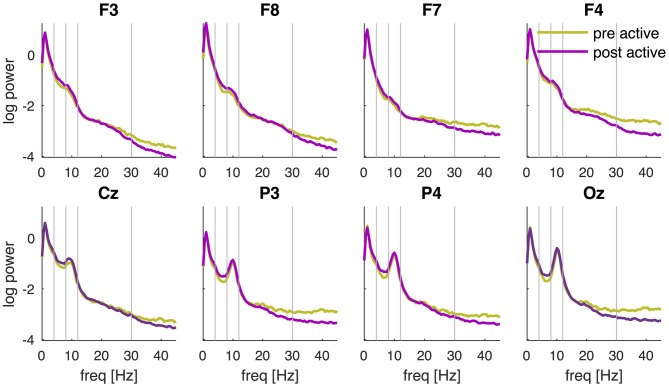
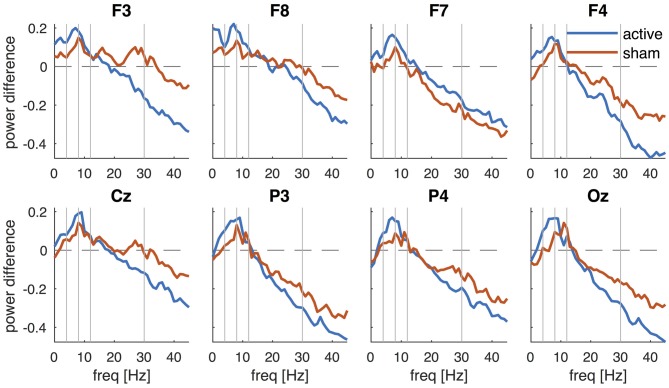
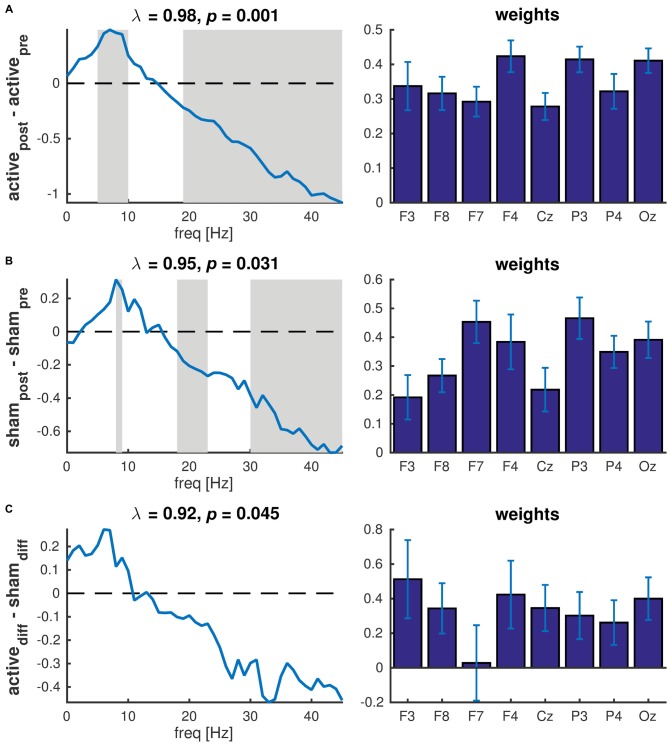
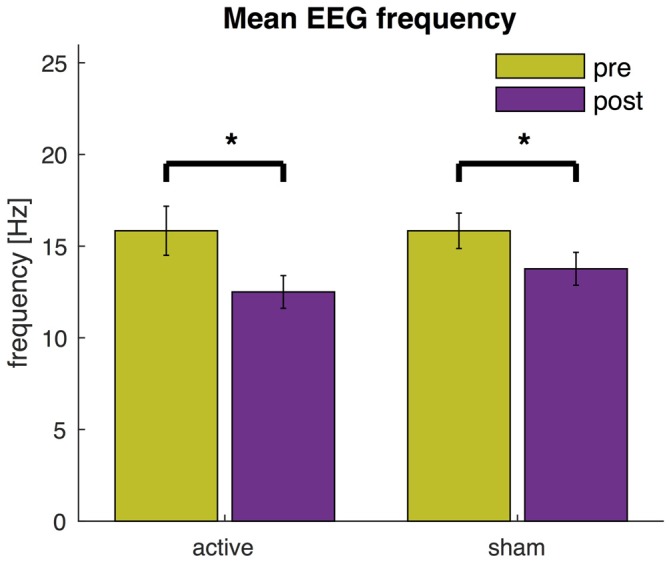
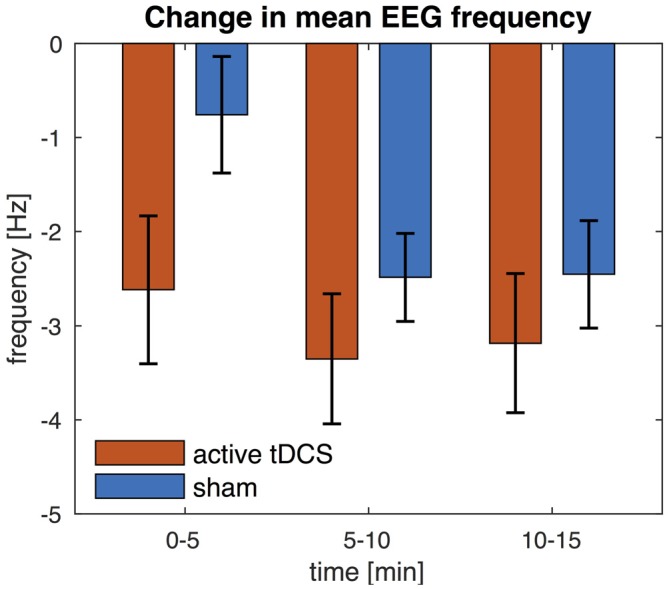
Transcranial direct current stimulation (tDCS) is proposed as a tool to investigate cognitive functioning in healthy people and as a treatment for various neuropathological disorders. However, the underlying cortical mechanisms remain poorly understood. We aim to investigate whether resting-state electroencephalography (EEG) can be used to monitor the effects of tDCS on cortical activity. To this end we tested whether the spectral content of ongoing EEG activity is significantly different after a single session of active tDCS compared to sham stimulation. Twenty participants were tested in a sham-controlled, randomized, crossover design. Resting-state EEG was acquired before, during and after active tDCS to the left dorsolateral prefrontal cortex (15 min of 2 mA tDCS) and sham stimulation. Electrodes with a diameter of 3.14 cm(2) were used for EEG and tDCS. Partial least squares (PLS) analysis was used to examine differences in power spectral density (PSD) and the EEG mean frequency to quantify the slowing of EEG activity after stimulation. PLS revealed a significant increase in spectral power at frequencies below 15 Hz and a decrease at frequencies above 15 Hz after active tDCS (P = 0.001). The EEG mean frequency was significantly reduced after both active tDCS (P < 0.0005) and sham tDCS (P = 0.001), though the decrease in mean frequency was smaller after sham tDCS than after active tDCS (P = 0.073). Anodal tDCS of the left DLPFC using a high current density bi-frontal electrode montage resulted in general slowing of resting-state EEG. The similar findings observed following sham stimulation question whether the standard sham protocol is an appropriate control condition for tDCS.

Keywords: DLPFC; EEG mean frequency; cortical oscillations; healthy volunteer; tDCS.


Figures

Figure 1
Figure 1
Experimental protocol. (A) Integrated transcranial direct current stimulation (tDCS) and electroencephalography (EEG) device (Starstim, Neuroelectrics Barcelona SL, Spain); (B) Anodal tDCS delivered to the left dorsolateral prefrontal cortex (anode: F3, cathode: F8) and the other six electrodes were used for EEG; (C) Electrical current waveforms associated with active tDCS and sham; (D) Participants were randomly assigned to receive either active or sham tDCS on the first session. All participants were fully crossed over to the other condition in the second session; (E) Model simulation using HDExploreTM (Soterix Medical, New York, NY, USA) of the pattern of current strength associated with the bi-frontal tDCS montage used in this study.
Figure 2
Figure 2
EEG data of a representative participant. (A) Butterfly plot of the six EEG channels (F7, F4, Cz, P3, P4, Oz) during the 38-min recording. Shaded area shows the interval of active tDCS. (B–D) Shows the corresponding power spectral density (PSD) of the six EEG channels during the interval before tDCS (B), during tDCS (C), and following tDCS (D). Thick black lines show the average PSD across channels. Vertical lines separate the frequencies into the conventional frequency bands: delta (0–4 Hz), theta (4–8 Hz), alpha (8–12 Hz), beta (13–30 Hz) and lower gamma (30–45 Hz).
Figure 3
Figure 3
PSD pre and post active tDCS. PSD is determined during the resting-state recording pre and post tDCS and averaged across participants for each EEG channel (F3, F8, F7, F4, Cz, P3, P4 and Oz) separately. Power is displayed on a logarithmic scale. Vertical lines separate the frequencies into the conventional frequency bands: delta (0–4 Hz), theta (4–8 Hz), alpha (8–12 Hz), beta (13–30 Hz) and lower gamma (30–45 Hz).
Figure 4
Figure 4
Change in PSD after active tDCS and sham. PSDpost is contrasted against PSDpre and averaged across participants for each EEG channel (F3, F8, F7, F4, Cz, P3, P4 and Oz) separately. Vertical lines separate the frequencies into the conventional frequency bands: delta (0–4 Hz), theta (4–8 Hz), alpha (8–12 Hz), beta (13–30 Hz) and lower gamma (30–45 Hz).
Figure 5
Figure 5
Partial least squares (PLS) of PSD across all EEG channels. (A) Contrast between pre and post active tDCS; (B) Contrast between pre and post sham; (C) Contrast between difference in active tDCS and sham. Left panels show the latent variables (frequency spectra) of each significant component revealing the changes in spectral power between conditions. The gray patches show the frequencies at which the difference was statistically significant as determined used bootstrapping. λ indicates the explained variance and p the p-value determined using permutation testing. Right panels show the corresponding weights reflecting the contribution of each EEG channel to the significant component. Error bars reflect the standard deviation estimated using bootstrapping.
Figure 6
Figure 6
EEG mean frequency before and after active tDCS and sham. The mean frequency is averaged across all EEG channels. Error bars indicate the standard error and asterisks changes that are statistically significant (P < 0.05).
Figure 7
Figure 7
Change in EEG mean frequency over time. The mean frequency is averaged across all EEG channels. Change in mean frequency is shown for three separate time intervals (0–5, 5–10 and 10–15 min) and relative to pre-stimulation baseline. Error bars indicate the standard error.
Figure 8
Figure 8
Relationship between subjective ratings of their physiological state and the EEG mean frequency. (A) Violin plot of subjective ratings of sleepiness, alertness and vigor before and after active tDCS and sham. Note, that polarity of sleepiness is reversed such that a higher rating means one is less sleepy. Yellow circles depict the median across participants and asterisks changes that are statistically significant (P < 0.05). (B) Relationship between changes in EEG mean frequency (on x-axis) and changes in subjective ratings of participant’s physiological state (y-axis). Changes are computed as post minus pre. Data for each participant are shown as red circles in active tDCS and blue asterisks for sham tDCS.

References

    1. Accornero N., Capozza M., Pieroni L., Pro S., Davì L., Mecarelli O. (2014). EEG mean frequency changes in healthy subjects during prefrontal transcranial direct current stimulation. J. Neurophysiol. 112, 1367–1375. 10.1152/jn.00088.2014 - DOI - PubMed
    1. Antal A., Terney D., Poreisz C., Paulus W. (2007). Towards unravelling task-related modulations of neuroplastic changes induced in the human motor cortex. Eur. J. Neurosci. 26, 2687–2691. 10.1111/j.1460-9568.2007.05896.x - DOI - PubMed
    1. Arul-Anandam A. P., Loo C. (2009). Transcranial direct current stimulation: a new tool for the treatment of depression? J. Affect. Disord. 117, 137–145. 10.1016/j.jad.2009.01.016 - DOI - PubMed
    1. Baker J. M., Rorden C., Fridriksson J. (2010). Using transcranial direct-current stimulation to treat stroke patients with aphasia. Stroke 41, 1229–1236. 10.1161/STROKEAHA.109.576785 - DOI - PMC - PubMed
    1. Bastani A., Jaberzadeh S. (2012). Does anodal transcranial direct current stimulation enhance excitability of the motor cortex and motor function in healthy individuals and subjects with stroke: a systematic review and meta-analysis. Clin. Neurophysiol. 123, 644–657. 10.1016/j.clinph.2011.08.029 - DOI - PubMed

LinkOut - more resources