. 2016 Jun 10:10:275.
doi: 10.3389/fnhum.2016.00275. eCollection 2016.

Distinct and Overlapping Brain Areas Engaged during Value-Based, Mathematical, and Emotional Decision Processing

Affiliations

Distinct and Overlapping Brain Areas Engaged during Value-Based, Mathematical, and Emotional Decision Processing

Chun-Wei Hsu et al. Front Hum Neurosci. .

Abstract

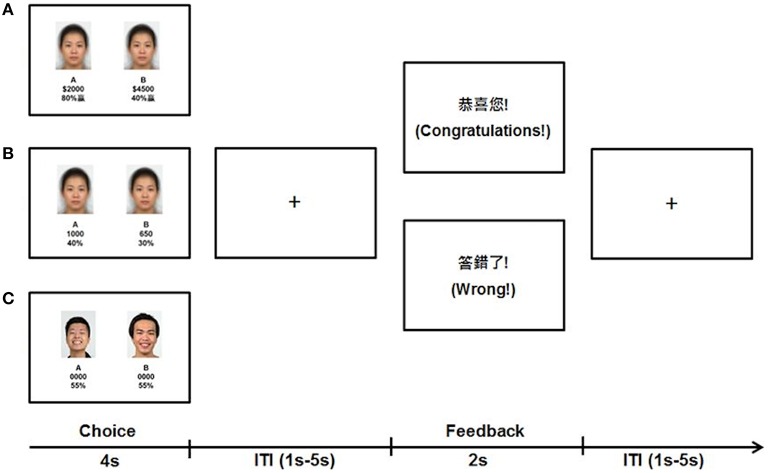
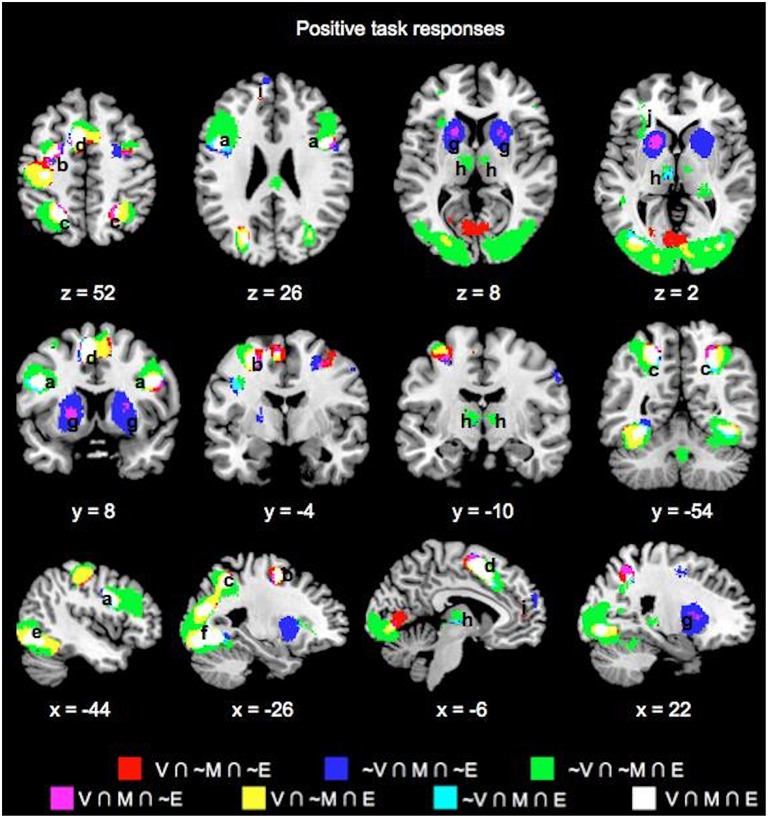
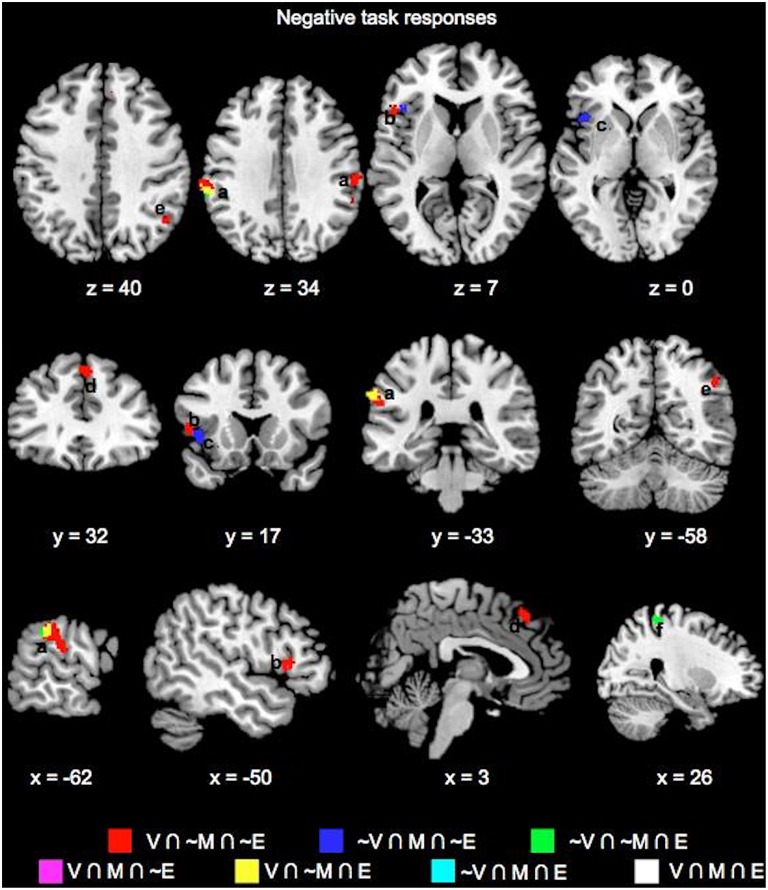
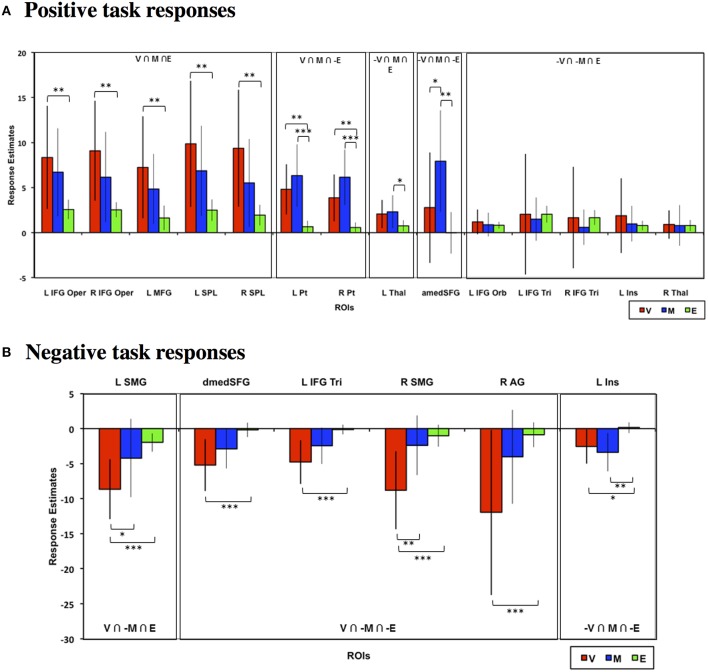
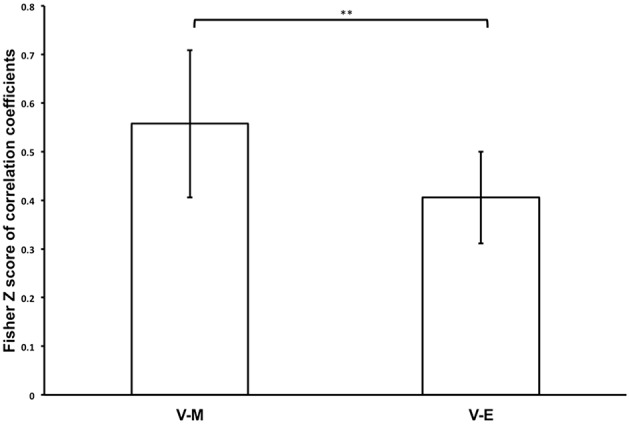
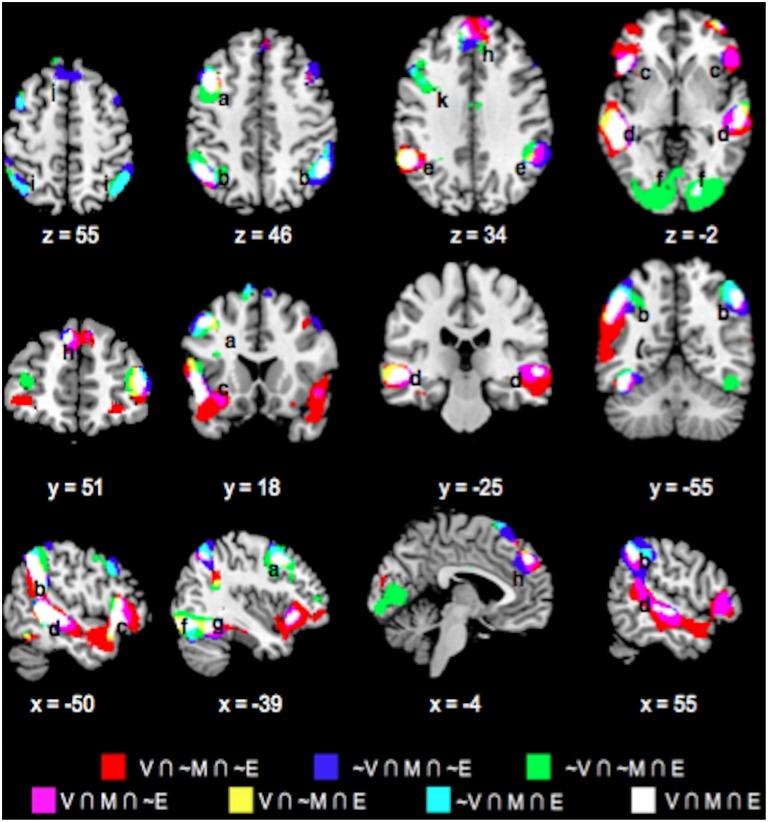
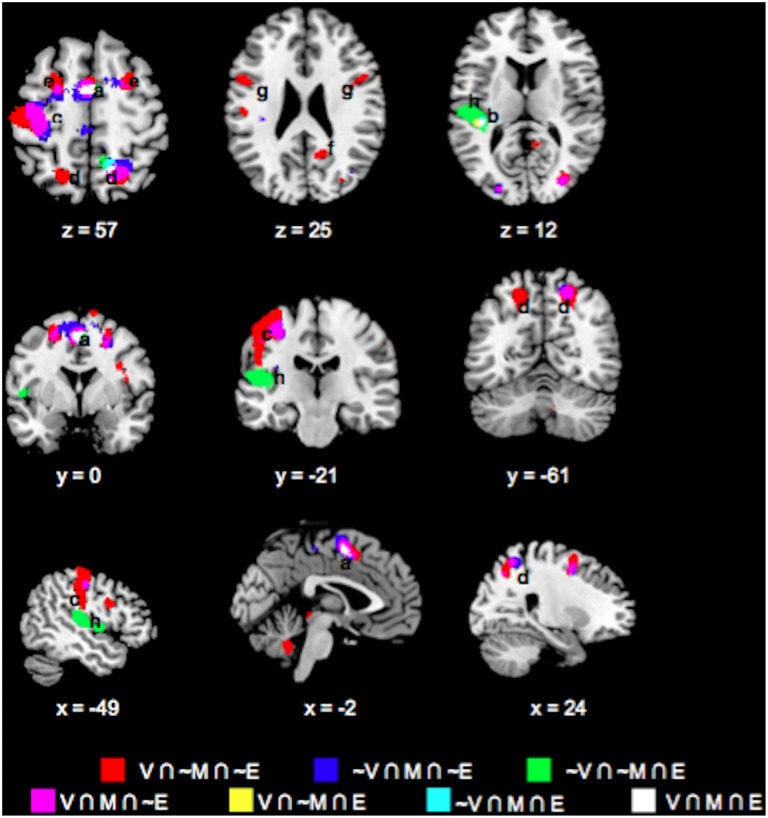
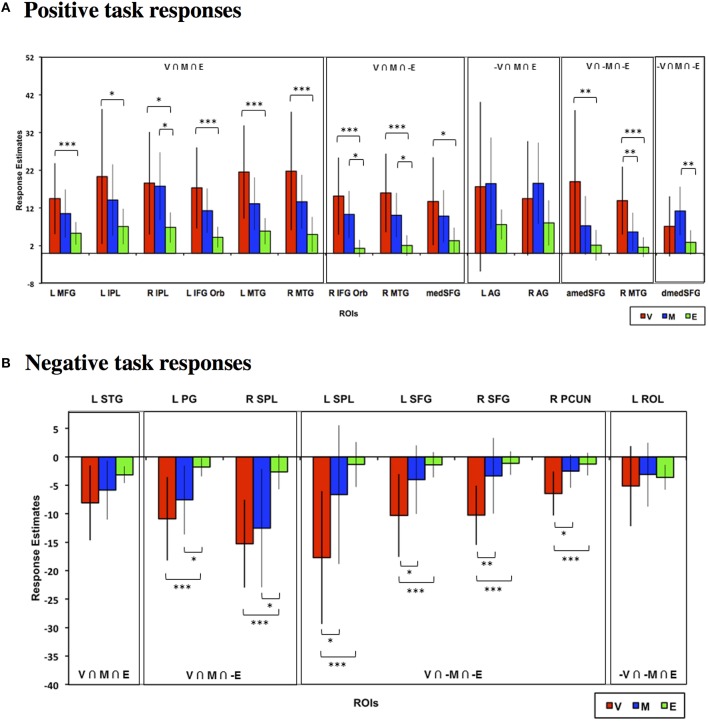
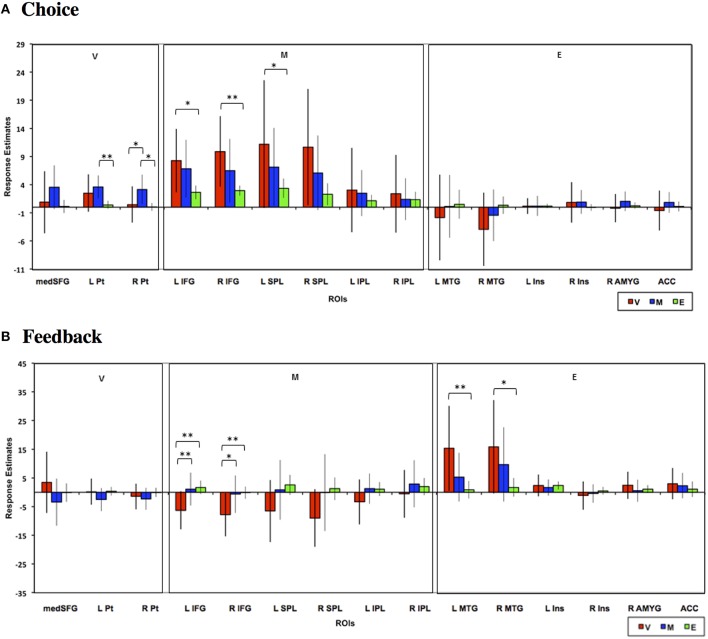
When comparing between the values of different choices, human beings can rely on either more cognitive processes, such as using mathematical computation, or more affective processes, such as using emotion. However, the neural correlates of how these two types of processes operate during value-based decision-making remain unclear. In this study, we investigated the extent to which neural regions engaged during value-based decision-making overlap with those engaged during mathematical and emotional processing in a within-subject manner. In a functional magnetic resonance imaging experiment, participants viewed stimuli that always consisted of numbers and emotional faces that depicted two choices. Across tasks, participants decided between the two choices based on the expected value of the numbers, a mathematical result of the numbers, or the emotional face stimuli. We found that all three tasks commonly involved various cortical areas including frontal, parietal, motor, somatosensory, and visual regions. Critically, the mathematical task shared common areas with the value but not emotion task in bilateral striatum. Although the emotion task overlapped with the value task in parietal, motor, and sensory areas, the mathematical task also evoked responses in other areas within these same cortical structures. Minimal areas were uniquely engaged for the value task apart from the other two tasks. The emotion task elicited a more expansive area of neural activity whereas value and mathematical task responses were in more focal regions. Whole-brain spatial correlation analysis showed that valuative processing engaged functional brain responses more similarly to mathematical processing than emotional processing. While decisions on expected value entail both mathematical and emotional processing regions, mathematical processes have a more prominent contribution particularly in subcortical processes.

Keywords: arithmetic processing; cognitive neuroscience; decision-making; emotion; fMRI.


Figures

Figure 1
Figure 1
Sample stimuli and trial timeline of the three decision tasks. (A) In the Value task, participants decided whether they preferred the lottery in (A,B) based on the magnitude of money and percentage probability of obtaining the money depicted. (B) In the Mathematical task, participants multiplied the magnitude of points and percentages and selected the bigger product of (A,B). (C) In the Emotion task, participants chose the person in (A,B) whom they felt might share more money with them.
Figure 2
Figure 2
Overlay maps showing key brain regions with significant positive task responses during the choice phases of the Value (V), Mathematical (M), and Emotion (E) tasks, as well as their overlapping areas. Region labels: (a) Bilateral Inferior Frontal Gyri, (b) L Middle Frontal Gyrus, (c) Bilateral Superior/Inferior Parietal Lobules, (d) Bilateral Supplementary Motor Areas, (e) Bilateral Occipital areas, (f) L Fusiform Gyrus, (g) Bilateral Putamen, (h) Bilateral Thalamus, (i) Bilateral Anterior Medial Superior Frontal Gyri, (j) L Insula. Voxel significance threshold was set at p < 0.001 with cluster size 50.
Figure 3
Figure 3
Overlay maps showing key brain regions with significant negative task responses during the choice phases of the Value (V), Mathematical (M), and Emotion (E) tasks, as well as their overlapping areas. Region labels: (a) Bilateral Supramarginal Gyrus, (b) L Inferior Frontal Gyrus, (c) L Insula, (d) L Dorsal Medial Superior Frontal Gyrus, (e) R Angular Gyrus, (f) R Postcentral Gyrus. Voxel significance threshold was set at p < 0.001 with cluster size 50.
Figure 4
Figure 4
Mean estimated neural responses during the choice phases of the Value (V), Mathematical (M), and Emotion (E) tasks in ROIs based on the conjunction analyses. Error bars denote 95% confidence intervals. Plots are shown for ROIs showing (A) Positive and (B) negative task responses (*p < 0.05, **p < 0.01, ***p < 0.001). Region labels: L IFG Oper, Left Inferior Frontal Gyrus Pars Opercularis; R IFG Oper, Right Inferior Frontal Gyrus Pars Opercularis; L MFG, Left Middle Frontal Gyrus; L SPL, Left Superior Parietal Lobule; R SPL, Right Superior Parietal Lobule; L Pt, Left Putamen; R Pt, Right Putamen; L Thal, Left Thalamus; amedSFG, Anterior Medial Superior Frontal Gyrus; dmedSFG, Dorsal Medial Superior Frontal Gyrus; L IFG Orb, Left Inferior Frontal Gyrus Pars Orbitalis; L IFG Tri, Left Inferior Frontal Gyrus Pars Triangularis; R IFG Tri, Right Inferior Frontal Gyrus Pars Triangularis; L Ins, L Insula (for positive task response: −30, 18, 3; for negative task responses: −42, 18, 0), R Thal, Left Thalamus; L SMG, Left Supramarginal Gyrus; R SMG, Right Supramarginal Gyrus; R AG, Right Angular Gyrus.
Figure 5
Figure 5
Bar graph showing mean Fisher Z-transforms of V-M and V-E correlations for the whole participant sample (**p < 0.01). Error bars denote 95% confidence intervals.
Figure 6
Figure 6
Overlay maps showing key brain regions with significant positive task responses during the Feedback phases of the Value (V), Mathematical (M), and Emotion (E) tasks, as well as their overlapping areas. Region labels: (a) Bilateral Angular Gyrus, (b) Bilateral Medial Superior Frontal Gyri (BA8), (c) Bilateral Inferior Parietal Lobule, (d) L Middle Frontal Gyrus (BA9), (e) Bilateral Medial Superior Frontal Gyri (BA9), (f) Bilateral Supramarginal Gyri, (g) L Precentral gyrus, (h) Bilateral Middle Temporal Gyri, (i) Bilateral Inferior Frontal Gyri (BA45/47), (j) Bilateral Inferior Occipital Gyri, (k) R Middle Frontal Gyrus (BA46), (l) L Fusiform Gyrus. Voxel significance threshold was set at p < 0.001 with cluster size 50.
Figure 7
Figure 7
Overlay maps showing brain regions with significant negative task responses during the Feedback phases of the Value (V), Mathematical (M), and Emotion (E) tasks, as well as their overlapping areas. Region labels: (a) Bilateral Supplementary Motor Area, (b) R Superior Parietal Lobule, (c) L Postcentral Gyrus, (d) Bilateral Superior Frontal Gyri, (e) R Precuneus, (f) Bilateral Precentral Gyri, (g) L Superior Temporal Gyrus, (h) L Rolandic Operculum, (i) R Middle Frontal Gyrus (BA 6). Voxel significance threshold was set at p < 0.001 with cluster size 50.
Figure 8
Figure 8
Mean estimated neural responses during the feedback phases of the Value (V), Mathematical (M), and Emotion (E) tasks in ROIs based on the conjunction analyses. Error bars denote 95% confidence intervals. Plots are shown for ROIs showing (A) Positive and (B) negative task responses (*p < 0.05, **p < 0.01, ***p < 0.001). Region labels: L IFG Oper, Left Inferior Frontal Gyrus Pars Opercularis; R IFG Oper, Right Inferior Frontal Gyrus Pars Opercularis; L MFG, Left Middle Frontal Gyrus; L SPL, Left Superior Parietal Lobule; R SPL, Right Superior Parietal Lobule; L Pt, Left Putamen; R Pt, Right Putamen; L Thal, Left Thalamus; medSFG, Medial Superior Frontal Gyrus; L IFG Orb, Left Inferior Frontal Gyrus Pars Orbitalis; L IFG Tri, Left Inferior Frontal Gyrus Pars Triangularis; R IFG Tri, Right Inferior Frontal Gyrus Pars Triangularis; L Ins, L Insula (for positive task response: −30, 18, 3; for negative task responses: −42, 18, 0), R Thal, Left Thalamus; L SMG, Left Supramarginal Gyrus; R SMG, Right Supramarginal Gyrus; R AG, Right Angular Gyrus.
Figure 9
Figure 9
Mean estimated neural responses during the (A) choice and (B) feedback phases of the Value (V), Mathematical (M), and Emotion (E) tasks in ROIs based on meta-analytic studies that identified Value, Mathematical, and Emotion processing ROIs (see Materials and Methods). Error bars denote 95% confidence intervals (*p < 0.05, **p < 0.01). Region labels: medSFG, Medial Superior Frontal Gyrus; L Pt, Left Putamen; R Pt, Right Putamen; L IFG, Left Inferior Frontal Gyrus; R IFG, Right Inferior Frontal Gyrus; L SPL, Left Superior Parietal Lobule; R SPL, Right Superior Parietal Lobule; L IPL, Left Inferior Parietal Lobule; R IPL, Right Inferior Parietal Lobule; L MTG, Left Middle Temporal Gyrus; R MTG, Right Middle Temporal Gyrus; L Ins, Left Insula; R Ins, Right Insula; R AMYG, Right Amygdala; ACC, Anterior Cingulate Cortex.

References

    1. Andersen R. A., Cui H. (2009). Intention, action planning, and decision making in parietal-frontal circuits. Neuron 63, 568–583. 10.1016/j.neuron.2009.08.028 - DOI - PubMed
    1. Anderson A. K., Christoff K., Panitz D., De Rosa E., Gabrieli J. D. (2003). Neural correlates of the automatic processing of threat facial signals. J. Neurosci. 23, 5627–5633. Retrieved from: http://www.jneurosci.org/content/23/13/5627.long - PMC - PubMed
    1. Andrews-Hanna J. R., Reidler J. S., Huang C., Buckner R. L. (2010). Evidence for the default network's role in spontaneous cognition. J. Neurophysiol. 104, 322–335. 10.1152/jn.00830.2009 - DOI - PMC - PubMed
    1. Arsalidou M., Taylor M. J. (2011). Is 2 + 2 = 4? Meta-analyses of brain areas needed for numbers and calculations. Neuroimage 54, 2382–2393. 10.1016/j.neuroimage.2010.10.009 - DOI - PubMed
    1. Banks S. J., Eddy K. T., Angstadt M., Nathan P. J., Phan K. L. (2007). Amygdala-frontal connectivity during emotion regulation. Soc. Cogn. Affect. Neurosci. 2, 303–312. 10.1093/scan/nsm029 - DOI - PMC - PubMed

LinkOut - more resources