. 2016 Jun 9:7:846.
doi: 10.3389/fmicb.2016.00846. eCollection 2016.

Fungal and Prokaryotic Activities in the Marine Subsurface Biosphere at Peru Margin and Canterbury Basin Inferred from RNA-Based Analyses and Microscopy

Affiliations

Fungal and Prokaryotic Activities in the Marine Subsurface Biosphere at Peru Margin and Canterbury Basin Inferred from RNA-Based Analyses and Microscopy

Maria G Pachiadaki et al. Front Microbiol. .

Abstract

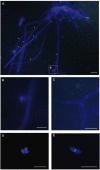
The deep sedimentary biosphere, extending 100s of meters below the seafloor harbors unexpected diversity of Bacteria, Archaea, and microbial eukaryotes. Far less is known about microbial eukaryotes in subsurface habitats, albeit several studies have indicated that fungi dominate microbial eukaryotic communities and fungal molecular signatures (of both yeasts and filamentous forms) have been detected in samples as deep as 1740 mbsf. Here, we compare and contrast fungal ribosomal RNA gene signatures and whole community metatranscriptomes present in sediment core samples from 6 and 95 mbsf from Peru Margin site 1229A and from samples from 12 and 345 mbsf from Canterbury Basin site U1352. The metatranscriptome analyses reveal higher relative expression of amino acid and peptide transporters in the less nutrient rich Canterbury Basin sediments compared to the nutrient rich Peru Margin, and higher expression of motility genes in the Peru Margin samples. Higher expression of genes associated with metals transporters and antibiotic resistance and production was detected in Canterbury Basin sediments. A poly-A focused metatranscriptome produced for the Canterbury Basin sample from 345 mbsf provides further evidence for active fungal communities in the subsurface in the form of fungal-associated transcripts for metabolic and cellular processes, cell and membrane functions, and catalytic activities. Fungal communities at comparable depths at the two geographically separated locations appear dominated by distinct taxa. Differences in taxonomic composition and expression of genes associated with particular metabolic activities may be a function of sediment organic content as well as oceanic province. Microscopic analysis of Canterbury Basin sediment samples from 4 and 403 mbsf produced visualizations of septate fungal filaments, branching fungi, conidiogenesis, and spores. These images provide another important line of evidence supporting the occurrence and activity of fungi in the deep subseafloor biosphere.

Keywords: DNA; calcofluor white; fungi; iTAG; mRNA; metatranscriptome; rRNA operon; sediment.


Figures

FIGURE 1
FIGURE 1
Relative expression (presented as RPKM values) of genes associated with amino acid/peptide transporters: BCA ABC trans, branched-chain amino acid ABC transporter, amino acid-binding protein; BCA aminotrans, branched-chain amino acid aminotransferase; DppB, dipeptide transport system permease protein DppB; LivF, branched-chain amino acid transport ATP-binding protein LivF; LivH, high-affinity branched-chain amino acid transport system permease protein LivH; LivG, branched-chain amino acid transport ATP-binding protein LivG; OppA, oligopeptide ABC transporter, periplasmic oligopeptide-binding protein OppA; OppB, oligopeptide transport system permease protein OppB; OppF, oligopeptide transport ATP-binding protein OppF; LivM, branched-chain amino acid transport system permease protein LivM; OppD, oligopeptide transport ATP-binding protein OppD; OppC, oligopeptide transport system permease protein OppC; Oligo ABC trans, oligopeptide ABC transporter, periplasmic oligopeptide-binding protein; ACT peripl, ABC-type amino acid transport/signal transduction systems, periplasmic component/domain; ACT perm, ABC-type amino acid transport system, permease component; DPB ABC perm, ABC-type dipeptide/oligopeptide/nickel transport system, permease component; DPB ABC sub-bind, ABC-type polar amino acid transport system protein, substrate-binding protein; AC ABC trans, amino acid ABC transporter, periplasmic amino acid-binding protein; AC perm, amino acid permease; AC ABC trans ATP, amino acids ABC transporter, ATP-binding protein; AC ABC trans perm, amino acids ABC transporter, permease protein; BCA perm, branched-chain amino acid transport system carrier protein; Cystine trans, cystine ABC transporter, permease protein; DppC, dipeptide transport system permease protein DppC; GltI, glutamate aspartate periplasmic binding protein precursor GltI; PON ABC trans, peptide/opine/nickel uptake family ABC transporter, periplasmic substrate-binding protein; Urea ABC, urea ABC transporter, urea binding protein.
FIGURE 2
FIGURE 2
Relative expression (presented as RPKM values) of genes associated with sugar transporters: b-gluco ABC, beta-glucoside ABC transport system, sugar-binding protein; AglE, alpha-glucosides-binding periplasmic protein AglE precursor; MalE, maltose/maltodextrin ABC transporter, substrate binding periplasmic protein MalE; YcjN, ABC-type sugar transport system, periplasmic binding protein YcjN; Sugar ABC sugar-b, sugar ABC transporter sugar-binding protein; N-acetyl-D-glucosamine ABC perm, N-acetyl-D-glucosamine ABC transport system, permease protein 2; N-acetyl-D-glucosamine ABC sugar-b, N-acetyl-D-glucosamine ABC transport system, sugar-binding protein; MalK, maltose/maltodextrin transport ATP-binding protein MalK (EC 3.6.3.19); Multi sugar ABC ATP-b, multiple sugar ABC transporter, ATP-binding protein; N-acetyl-D-glucosamine ABC ATP-b, N-acetyl-D-glucosamine ABC transport system ATP-binding protein; Sugar ABC peripl, ABC-type sugar transport system, periplasmic component; MglC, galactose/methyl galactoside ABC transport system, permease protein MglC; Sugar ABC ATPase, ABC-type sugar transport systems, ATPase components; MalG, maltose/maltodextrin ABC transporter, permease protein MalG; RbsB, ribose ABC transport system, periplasmic ribose-binding protein RbsB; Rbs perm, ribose ABC transporter (permease); PTS mannose IIC, PTS system, mannose-specific IIC component; PTS cellobiose IIC, PTS system, cellobiose-specific IIC component (EC 2.7.1.69); PTS sucrose IIB, PTS system, sucrose-specific IIB component (EC 2.7.1.69)/PTS system, sucrose-specific IIC component (EC 2.7.1.69)/PTS system, sucrose-specific IIA component (EC 2.7.1.69); PTS HrsA, PTS system HrsA EIIA component/PTS system HrsA EIIB component/PTS system HrsA permease IIC component.
FIGURE 3
FIGURE 3
Heat map highlighting the difference of fungal OTUs between 6 and 95 mbsf Peru Margin sediment samples using iTAG. Numbers presented are the percentage of reads for a particular OTU in each sample. Colors correspond to the relative abundance of individual OTUs across samples. Black corresponds to taxon present at ≥80%, dark gray ≥60%, light gray ≥40%, and white <40%. Dendograms are based on normalized read abundances for samples (top) and taxonomic groups (left). A complementary heat map highlights the overlapping genera () between this study and those of Orsi et al. (2013a) and Rédou et al. (2014).
FIGURE 4
FIGURE 4
Snapshot of fungal metabolic activities in 345.50 mbsf Canterbury Basin sediment sample. (A) Top 10 Gene Ontology (GO) terms based on GO analysis of biological processes, molecular functions, and cellular components (GO level 4). (B) Distribution of enzyme classes as a proxy for fungal catalytic activity.
FIGURE 5
FIGURE 5
Microscopical analysis of Calcofluor stained fungal cells using 4 mbsf (A–D) and 4000 mbsf (E) Canterbury Basin sediment samples. (A) Fungal hyphae compartmentalized by septa, highlighted with white stars (Scale bar, 10 μm). (B) Fungal conidiogenesis (Scale bar, 5 μm). (C) Fungal filamentous branching (Scale bar, 10 μm). (D) Cluster of fungal spores (Scale bar, 10 μm). (E) Fungal septate spore (Scale bar, 10 μm).

Similar articles

Cited by

References

    1. Adeyemi A. O. (2009). Bioaccumulation of arsenic in fungi. Am. J. Environ. Sci. 5 364–370. 10.3844/ajessp.2009.364.370 - DOI
    1. Alberti A., Belser C., Engelen S., Bertrand L., Orvain C., Brinas L., et al. (2014). Comparison of library preparation methods reveals their impact on interpretation of metatranscriptomic data. BMC Genomics 15:912 10.1186/1471-2164-15-912 - DOI - PMC - PubMed
    1. Altschul S. F., Gish W., Miller W., Myers E. W., Lipman D. J. (1990). Basic local alignment search tool. J. Mol. Biol. 215 403–410. 10.1016/S0022-2836(05)80360-2 - DOI - PubMed
    1. Amend A. (2014). From dandruff to deep-sea vents: Malassezia-like Fungi are ecologically hyper-diverse. PLoS Pathog. 10:e1004277 10.1371/journal.ppat.1004277 - DOI - PMC - PubMed
    1. Baker B. J., Saw J. H., Lind A. E., Lazar C. S., Hinrichs K.-U., Teske A. P., et al. (2016). Genomic inference of the metabolism of cosmopolitan subsurface Archaea, Hadesarchaea. Nat. Microbiol. 1 16002 10.1038/NMICROBIOL.2016.2 - DOI - PubMed

LinkOut - more resources