Metabolomic and Proteomic Profiles Reveal the Dynamics of Primary Metabolism during Seed Development of Lotus (Nelumbo nucifera)
- PMID: 27375629
- PMCID: PMC4894879
- DOI: 10.3389/fpls.2016.00750
Metabolomic and Proteomic Profiles Reveal the Dynamics of Primary Metabolism during Seed Development of Lotus (Nelumbo nucifera)
Abstract
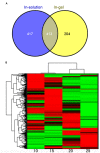
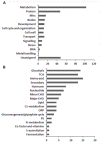
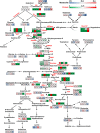
Sacred lotus (Nelumbo nucifera) belongs to the Nelumbonaceae family. Its seeds are widely consumed in Asian countries as snacks or even medicine. Besides the market value, lotus seed also plays a crucial role in the lotus life cycle. Consequently, it is essential to gain a comprehensive understanding of the development of lotus seed. During its development, lotus seed undergoes cell division, expansion, reserve accumulation, desiccation, and maturation phases. We observed morphological and biochemical changes from 10 to 25 days after pollination (DAP) which corresponded to the reserve synthesis and accumulation phase. The volume of the seed expanded until 20 DAP with the color of the seed coat changing from yellow-green to dark green and gradually fading again. Starch and protein rapidly accumulated from 15 to 20 DAP. To further reveal metabolic adaptation, primary metabolites and proteins profiles were obtained using mass spectrometry based platforms. Metabolites and enzymes involved in sugar metabolism, glycolysis, TCA cycle and amino acid metabolism showed sequential dynamics enabling the clear separation of the different metabolic states during lotus seed development. The integration of the data revealed a highly significant metabolic switch at 15 DAP going through a transition of metabolically highly active tissue to the preparation of storage tissue. The results provide a reference data set for the evaluation of primary metabolism during lotus seed development.
Keywords: GC-TOF-MS; LC-Orbitrap-MS; Nelumbo nucifera; mass spectrometry; primary metabolism; seed development.
Figures


Similar articles
-
Integration of metabolomics and transcriptomics analyses investigates the accumulation of secondary metabolites in maturing seed plumule of sacred lotus (Nelumbo nucifera).Food Res Int. 2023 Jan;163:112172. doi: 10.1016/j.foodres.2022.112172. Epub 2022 Nov 25. Food Res Int. 2023. PMID: 36596118
-
TMT-based quantitative proteomic and physiological analyses on lotus plumule of artificially aged seed in long-living sacred lotus Nelumbo nucifera.J Proteomics. 2023 Jan 6;270:104736. doi: 10.1016/j.jprot.2022.104736. Epub 2022 Sep 27. J Proteomics. 2023. PMID: 36174953
-
Unraveling the seed endosperm proteome of the lotus (Nelumbo nucifera Gaertn.) utilizing 1DE and 2DE separation in conjunction with tandem mass spectrometry.Proteomics. 2015 May;15(10):1717-35. doi: 10.1002/pmic.201400406. Epub 2015 Feb 12. Proteomics. 2015. PMID: 25545995
-
Current Advances in the Metabolomics Study on Lotus Seeds.Front Plant Sci. 2016 Jun 20;7:891. doi: 10.3389/fpls.2016.00891. eCollection 2016. Front Plant Sci. 2016. PMID: 27379154 Free PMC article. Review.
-
Comprehensive Analysis for GRF Transcription Factors in Sacred Lotus (Nelumbo nucifera).Int J Mol Sci. 2022 Jun 15;23(12):6673. doi: 10.3390/ijms23126673. Int J Mol Sci. 2022. PMID: 35743113 Free PMC article. Review.
Cited by
-
Transcriptome Analysis of Native Kentucky Bluegrass (Poa pratensis L.) in Response to Osmotic Stress.Plants (Basel). 2023 Nov 25;12(23):3971. doi: 10.3390/plants12233971. Plants (Basel). 2023. PMID: 38068609 Free PMC article.
-
Comparative proteomic analyses of Tartary buckwheat (Fagopyrum tataricum) seeds at three stages of development.Funct Integr Genomics. 2022 Dec;22(6):1449-1458. doi: 10.1007/s10142-022-00912-1. Epub 2022 Nov 11. Funct Integr Genomics. 2022. PMID: 36369301 Free PMC article.
-
Metabolomics-Driven Mining of Metabolite Resources: Applications and Prospects for Improving Vegetable Crops.Int J Mol Sci. 2022 Oct 11;23(20):12062. doi: 10.3390/ijms232012062. Int J Mol Sci. 2022. PMID: 36292920 Free PMC article. Review.
-
Comprehensive analysis of AGPase genes uncovers their potential roles in starch biosynthesis in lotus seed.BMC Plant Biol. 2020 Oct 6;20(1):457. doi: 10.1186/s12870-020-02666-z. BMC Plant Biol. 2020. PMID: 33023477 Free PMC article.
-
Evaluation of the Susceptibility of Lotus Seeds (Nelumbo nucifera Gaertn.) to Aspergillus flavus Infection and Aflatoxin Contamination.Toxins (Basel). 2024 Jan 7;16(1):29. doi: 10.3390/toxins16010029. Toxins (Basel). 2024. PMID: 38251245 Free PMC article.
References
-
- Bhat R., Sridhar K. R. (2008). Nutritional quality evaluation of electron beam-irradiated lotus (Nelumbo nucifera) seeds. Food Chem. 107 174–184. 10.1016/j.foodchem.2007.08.002 - DOI
LinkOut - more resources
Full Text Sources
Other Literature Sources
Molecular Biology Databases
Miscellaneous

