. 2016 Jun 3:7:781.
doi: 10.3389/fpls.2016.00781. eCollection 2016.

Quantitative Wood Anatomy-Practical Guidelines

Affiliations

Quantitative Wood Anatomy-Practical Guidelines

Georg von Arx et al. Front Plant Sci. .

Abstract

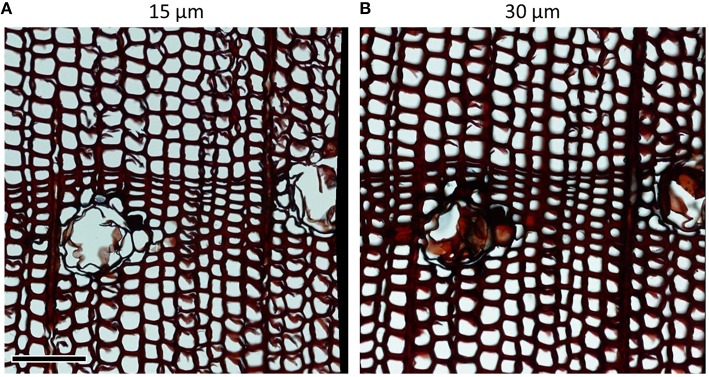
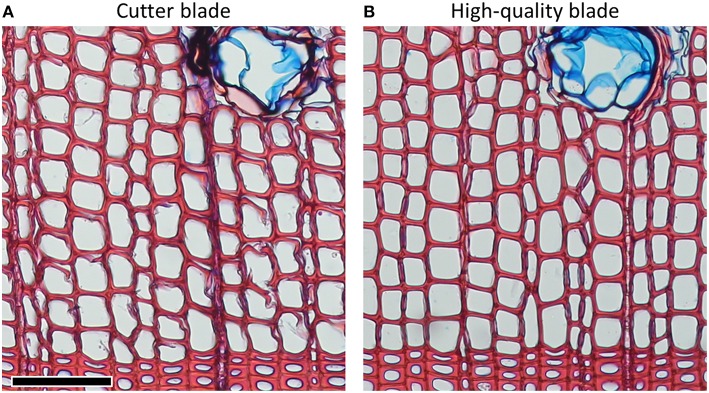
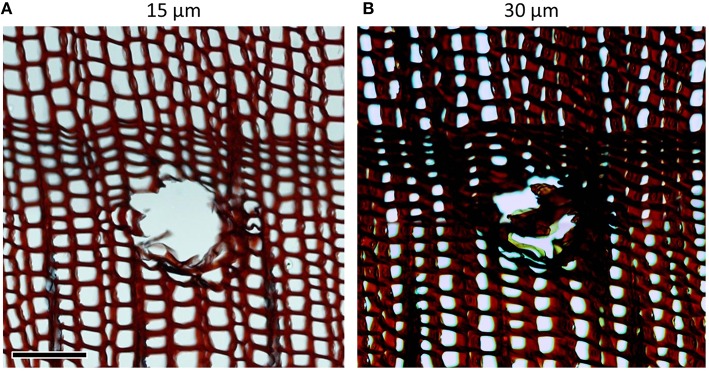
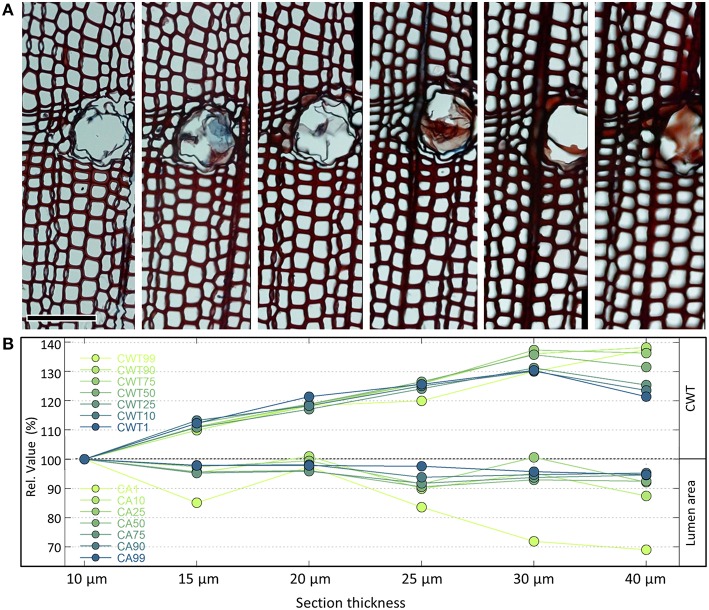
Quantitative wood anatomy analyzes the variability of xylem anatomical features in trees, shrubs, and herbaceous species to address research questions related to plant functioning, growth, and environment. Among the more frequently considered anatomical features are lumen dimensions and wall thickness of conducting cells, fibers, and several ray properties. The structural properties of each xylem anatomical feature are mostly fixed once they are formed, and define to a large extent its functionality, including transport and storage of water, nutrients, sugars, and hormones, and providing mechanical support. The anatomical features can often be localized within an annual growth ring, which allows to establish intra-annual past and present structure-function relationships and its sensitivity to environmental variability. However, there are many methodological challenges to handle when aiming at producing (large) data sets of xylem anatomical data. Here we describe the different steps from wood sample collection to xylem anatomical data, provide guidance and identify pitfalls, and present different image-analysis tools for the quantification of anatomical features, in particular conducting cells. We show that each data production step from sample collection in the field, microslide preparation in the lab, image capturing through an optical microscope and image analysis with specific tools can readily introduce measurement errors between 5 and 30% and more, whereby the magnitude usually increases the smaller the anatomical features. Such measurement errors-if not avoided or corrected-may make it impossible to extract meaningful xylem anatomical data in light of the rather small range of variability in many anatomical features as observed, for example, within time series of individual plants. Following a rigid protocol and quality control as proposed in this paper is thus mandatory to use quantitative data of xylem anatomical features as a powerful source for many research topics.

Keywords: QWA; anatomical sample preparation; dendroanatomy; microscopic imaging; microtome sectioning; quantitative image analysis; tree-ring anatomy; wood sample collection.


Figures

Figure 1
Figure 1
Damage to cell walls due to dull blades in Pinus heldreichii cross-sections of (A) 15 μm and (B) 30 μm thickness. In conifer samples, wall fragments rip off particularly easily at bordered pits. Such problems are aggravated in thinner sections as in panel (A). Scale bar = 100 μm.
Figure 2
Figure 2
Pinus sylvestris cross-sections of 15 μm thicknesses from the same wood piece cut with (A) cutter and (B) high-quality blades. Problems with disrupted cell structures can often be significantly reduced by using high-quality blades. Scale bar = 100 μm.
Figure 3
Figure 3
Cross-sections of Pinus heldreichii cut from a not properly oriented sample, i.e., cutting direction that is not perpendicular to the axial tracheid orientation. Non-orthogonal cross-sections result in underestimation of lumen area and overestimation of cell wall thickness. These measurement errors are weaker in (A) thinner than in (B) thicker sections as revealed after analyzing the entire images (c. 2500 cells; only subset images shown here) with the image-analysis tool ROXAS (cf. Table 1): mean cell lumen area in (B) was 43% smaller and mean tangential cell wall thickness 46% larger than in (A). Scale bar = 100 μm.
Figure 4
Figure 4
(A) Series of cross-sections of the same Pinus heldreichii wood piece using different cutting thicknesses from 10 to 40 μm (top row). The anatomical images are part of larger analyzed images containing each c. 4000 tracheids cells. The orientation of the samples is reasonably vertical, and images were produced keeping staining procedure and microscope settings standardized. Analyzing the images with the image-analysis tool ROXAS (cf. Table 1) using always the same settings reveals that the measured lumen area reduces markedly from the thinner to the thicker cross-sections (B). This effect is stronger for smaller cells with a 31% reduction in the lowest percentile of the cell lumen population (CA1) than for the largest cells with only 4–6% reduction (CA90, CA99). In contrast, the mean tangential cell wall thickness appears also for the thinnest walls (CWT1, belonging to the largest cells) up to 30% larger in thicker compared to thinner cross-sections. For the thickest cell walls (CWT99, belonging to the smallest cells) the cutting-thickness error was up to 40%. Note that the quantification of the measurement errors is based on the shown example only. To a certain extent some of the cutting-thickness errors can be alleviated by adjusting the settings of the image analyses, particularly the segmentation threshold (see Section Image Segmentation and Figure 10). Scale bar = 100 μm.
Figure 5
Figure 5
Image of a slide with some pollution as indicated by yellow arrows (A) before and (B) after cleaning (Pinus sylvestris). Scale bar = 100 μm.
Figure 6
Figure 6
Anatomical images of the same Pinus sylvestris microslide illustrating how imporper microscope settings such as (A) wrong white balance and (B) over-illumination reduce image contrast compared to (C) optimal settings. Suboptimal microscope settings may impede automatic detection of anatomical features and result in under- and over-estimation of anatomical features. Scale bar = 100 μm.
Figure 7
Figure 7
The same anatomical microslide of Pinus sylvestris once captured (A) out of focus and (B) with optimal focus (only subset images shown). The entire images were analyzed with the image-analysis tool ROXAS (cf. Table 1) using always the same settings. In the out-of-focus image, 178 small tracheids out of totally 4240 (4.2%) were not detected, because lumina of very narrow tracheids were insufficiently defined. Accordingly, the lumen area corresponding to the smallest 1% of the measured values (CA1) were 69% larger in the poorly-focused than the well-focused image, while in the largest tracheids (CA99) the lumina appeared 1% smaller in the poorly-focused images (C). Similarly, the thickest tangential cell walls (CWT99, corresponding to the very small tracheids) were overestimated by 9% in the poorly-focused compared to the well-focused image, while they were underestimated by 4% toward the thinnest walls (CWT1). Scale bar = 100 μm.
Figure 8
Figure 8
(A) Overlapping high-resolution images stitched together using PTGui and (B) the obtained high-resolution image of an entire Verbascum thapsus root cross-section. The used overlap with neighboring images is visualized for one of the images with yellow dashed lines in (A). The input images contained distortions introduced by the used optical system, which were successfully removed by PTGui (verified by creating a composite image of a stage micrometer and measuring the distances between tick marks, which yielded constant values throughout the image). Five randomly selected vessels along a transect (see labels in B) having an lumen area between 100 and 3500 μm2 were subsequently measured using ROXAS (Table 1) using always the same settings in images stitched with the software PTGui, AutoStitch, Microsoft Image Composite Editor and Photoshop (Automatic and Reposition settings). Panel (C) shows the percentage deviation of the obtained values compared to the PTGui reference values. The values in all used stitching tools and settings deviate from the PTGui reference, thus indicating distortions. In addition, the magnitude of the deviations varied along the transect often changing from over- to under-estimation. Note that Photoshop Reposition setting also produces distortion-free images if input images are already distortion-free, while AutoStitch still introduces distortions. Scale bar = 1 mm.
Figure 9
Figure 9
Top row (A–C) shows how tracheid lumina obscured by a dust particle on the cover glass of a Pinus leucodermis sample remain undetected using ordinary image processing, bottom row (D–F) shows how contrast homogenization technique (using the image-analysis tool ROXAS in this case) allows to automatically detect all lumina. Scale bar = 100 μm.
Figure 10
Figure 10
(A) Anatomical image of a Pinus sylvestris sample with (B) visualization of the segmentation threshold by a green mask and (C) the resulting binary image after performing the segmentation, which is the basis for quantifying the anatomical features. Depending on the image-analysis software the segmentation is applied to the original or processed color image, or a gray-scale image resulting from one to several image-processing steps (cf. Figure 9). Scale bar = 100 μm.
Figure 11
Figure 11
Defining the anatomical features in a (A) sub-optimal image of Quercus petraea (surface scan, 2400 dpi) as (B) vector instead of (C) pixel objects allows to correct some sample artifacts, e.g., by applying a convex outline filter. Panel (D) compares the percent deviation of vessel lumen area when representing the identical vessels in the selected image as pixels vs. vectors after analyzing the entire sample (>2500 vessels) with the image-analysis tool ROXAS. 20.2% of the measured values deviate by ≥5% from the supposedly more accurate vector object value, and 4.3% by ≥10%. While underestimation of lumen area in the pixel representation can be very strong due to artifacts as highlighted by the yellow arrows in (A–C), pixel representation also resulted in slight overestimation (<5%) of 21.6% of all vessels because of pixel rounding effects. Note that some of these deviations can be significantly reduced by manual editing. Scale bar = 1 mm.
Figure 12
Figure 12
(A) Cross-section of a Pinus sylvestris wood piece showing ripped-off cell walls. (B) Same sample with overlay of detected lumen outlines (cyan) without any correction, resulting in measurement errors. (C) A convex outline filter can correct such artifacts, but may also cut off true concavities in the lumen outlines, e.g., due to pit inflections (see examples highlighted by yellow arrows), while (D) a more powerful “protrusion filter” (as implemented in the image-analysis tool ROXAS) better discriminates between artifacts and true concavities. Scale bar = 100 μm.

References

    1. Aloni R. (2013). Role of hormones in controlling vascular differentiation and the mechanism of lateral root initiation. Planta 238, 819–830. 10.1007/s00425-013-1927-8 - DOI - PubMed
    1. Arbellay E., Corona C., Stoffel M., Fonti P., Decaulne A. (2012). Defining an adequate sample of earlywood vessels for retrospective injury detection in diffuse-porous species. PLoS ONE 7:e38824. 10.1371/journal.pone.0038824 - DOI - PMC - PubMed
    1. Carrer M., von Arx G., Castagnieri D., Petit G. (2015). Distilling environmental information from time series of conduit size: the standardization issue and its relation to allometric and hydraulic constraints. Tree Physiol. 35, 27–33. 10.1093/treephys/tpu108 - DOI - PubMed
    1. Castagneri D., Petit G., Carrer M. (2015). Divergent climate response on hydraulic-related xylem anatomical traits of Picea abies along a 900-m altitudinal gradient. Tree Physiol. 35, 1378–1387. 10.1093/treephys/tpv085 - DOI - PubMed
    1. Crivellaro A., Schweingruber F. H. (2015). Stem Anatomical Features of Dicotyledons. Xylem, Phloem, Cortex and Periderm Characteristics for Ecological and Taxonomical Analyses. Remagen: Kessel Publishing House.

LinkOut - more resources